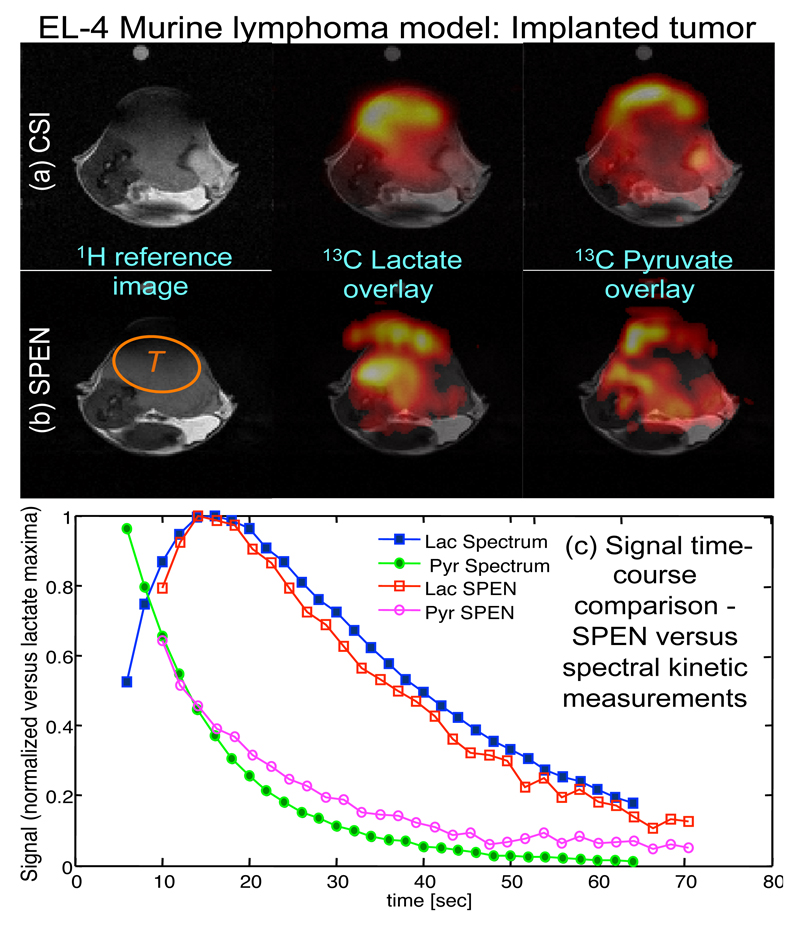
Figure 5.
Representative 13C images acquired after injection of [1-13C]pyruvate in mice. (a, b) 1H anatomic images overlaid with 13C images of pyruvate and lactate obtained using CSI and SPEN. The region indicated by “T” marks the approximate tumor location. (c) Comparison of the pyruvate and lactate time courses obtained with SPEN-based spectroscopic imaging and with 1D experiments. The SPEN time-course was obtained by averaging over a region of interest where the signal was most intense (from “T”). A flip angle of 20° and a repetition time of 2 s were used in both experiments.

