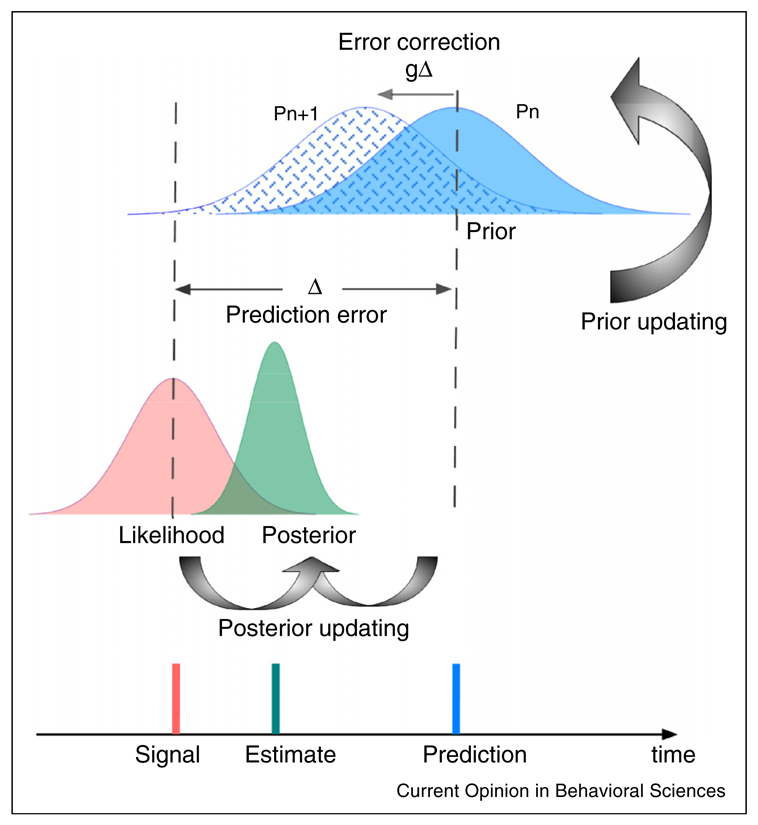
Figure I.
Schematic illustration of Bayesian inference of duration. The red curve denotes the likelihood P(S|D) for a given duration signal, the blue curve the prior at time n, and the dashed blue curve the updated prior at time n + 1. The dark green curve is the posterior based on Bayesian inference. There are two updating processes: the posterior updating based on the cues and the prior is for reliable sensory estimates, and the prior updating based on error correction is for minimizing forthcoming prediction errors.

