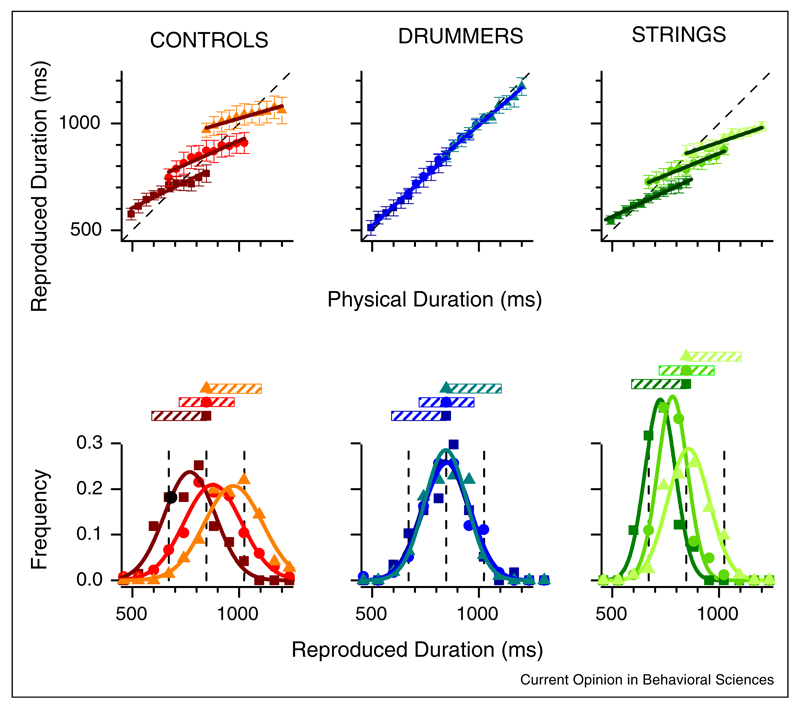
Figure 1.
Regression to the mean in a time-reproduction task. Upper graphs: average reproduction intervals as a function of physical reproduction for measurements made in three different durations: short (squares, 494–847 ms), intermediate (circles, 671–1024 ms), and long (triangle, 847–1200 ms). The graphs at left refer to control subjects with no musical training, those in center to trained drummers, at right to trained string-instrumentalists. All the non-drummers show a strong regression to the mean of that particular interval: drummers respond veridically. Lower graphs: response distributions for interval 850 ms, taken from the three different conditions (short, intermediate, and long; symbols as before). The direction of the bias depends on the interval, tending to under-estimation for the short interval and overestimation for the long interval.
Adapted from [8••].

