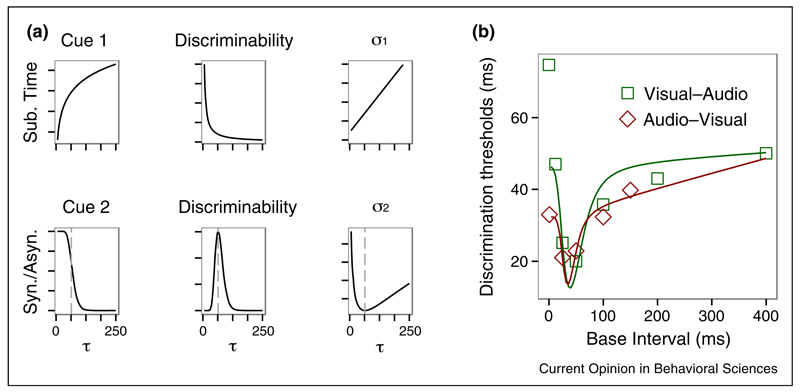
Figure 3.
(a) Illustration of how the MLE model combines two interval-discrimination cues. Cue 1 is based on the difference between the base interval (τ) and the comparison interval (τ + Δ), which we assume follows Weber’s law: σ1 = wfτ + c. Cue 2 comes from synchrony/asynchrony categorization: when one interval falls within the simultaneity window and the other does not, this is a strong cue as to which is longer. The probability of this occurring peaks near the boundary of the simultaneity. We assume the discriminability function is normal distributed in logarithmic. According to the MLE model (see Box 1), the discrimination threshold of the combined cues is (b) Interval discrimination thresholds for subject CL (dots) as a function the base interval, separated for audiovisual, and visual-auditory conditions (adapted from [35]), and the prediction of the MLE model (curves).

