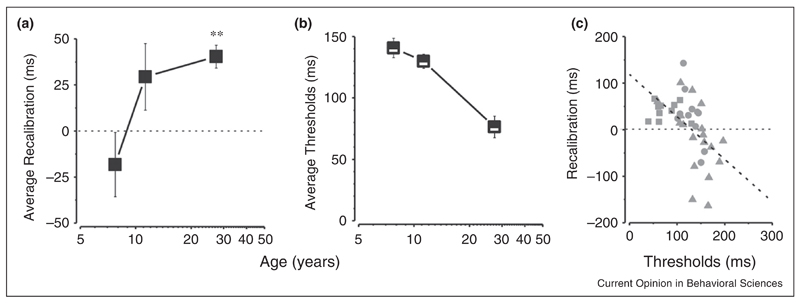
Figure 4.
How sensory-motor recalibration is affected by precision. (a) Average recalibration as a function of age. (b) Average thresholds as a function of age. (c) The recalibration effect as a function of thresholds: the correlation is strong (R2 = 0.25, p < 0.001, slope = −0.9).
Adapted from [12••].

