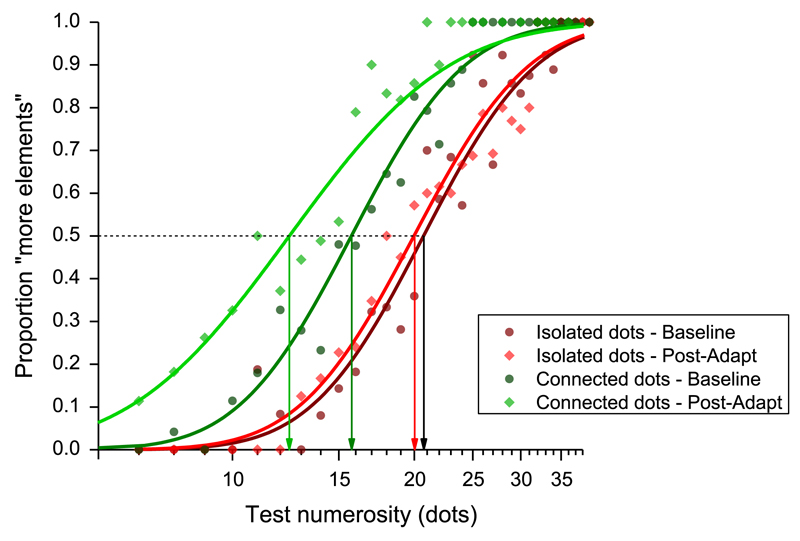
Fig. 1.
Psychometric curves for numerosity discrimination. Average psychometric functions were obtained pooling data of all the participants, plotting the proportion of trials in which the test stimulus appeared more numerous than the reference. Dark red and dark green curves refer to the baseline conditions either with isolated dots (dark red) or with dots connected by lines (dark green). Light red and light green curves refer to the post-adaptation performances, for the isolated and connected dots conditions, respectively. (For interpretation of the references to colour in this figure legend, the reader is referred to the web version of this article.)

