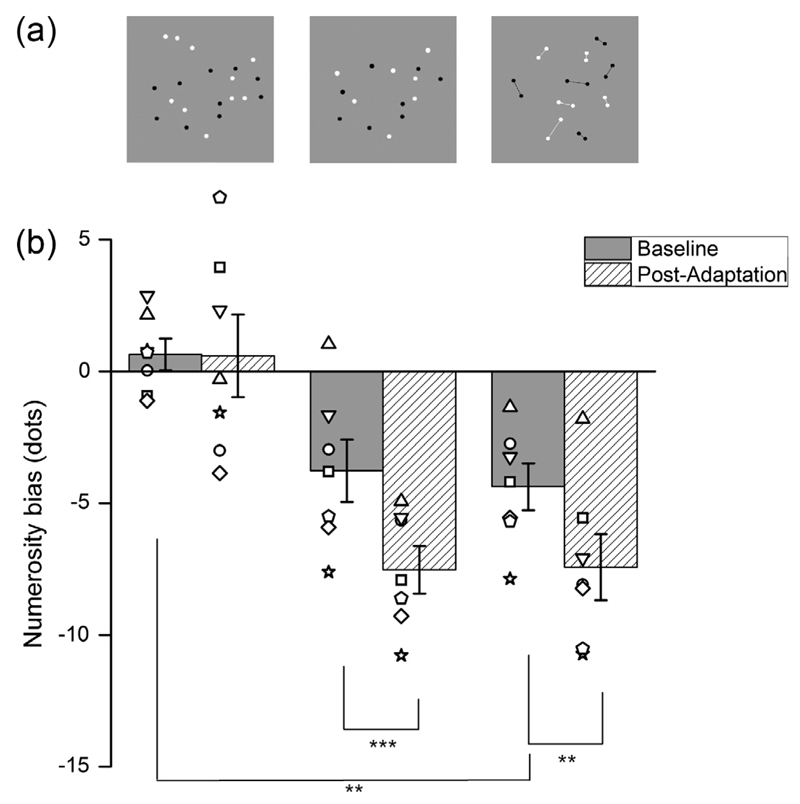
Fig. 2.
Adaptation effect for the three conditions. Numerosity bias of a test patch before and after adaptation (grey and hatched bars), with individual data shown by the symbols (different shape for each subject). Three different conditions are plotted (showed in panel a): twenty unconnected dots; a reduced number of unconnected dots (matching the numerosity of the connected stimulus); and twenty dots connected by ten lines. Error bars indicate S.E.M., Stars indicate statistical significance (*p < 0.05,**p < 0.01, ***p < 0.001).

