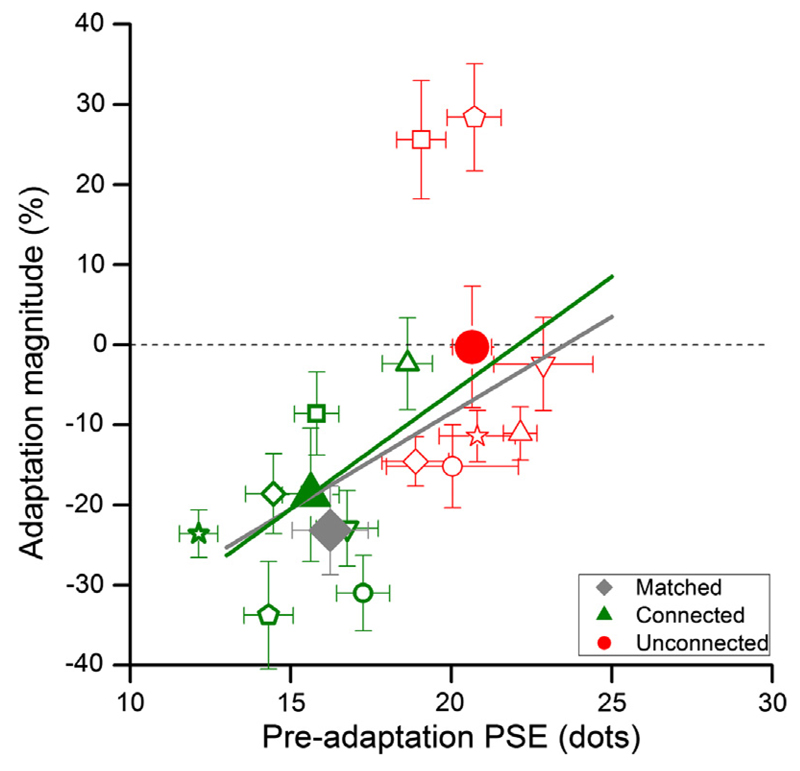
Fig. 3.
Individual data. Individual data for the connected (green symbols) and unconnected (red symbols) conditions, plotting change in PSE normalized by baseline against baseline PSE. The large symbols show group averages, the grey diamond the average of the matched, unconnected condition. There is little effect of adaptation on the unconnected dots (average adaptation −0.087% ± 7.75), while adaptation had a clear effect for almost all subjects in the connected condition (average adaptation −20.11% ± 4.64), similar to that of the matched, unconnected condition (average adaptation −23.10% ± 1.67). (For interpretation of the references to colour in this figure legend, the reader is referred to the web version of this article.)

