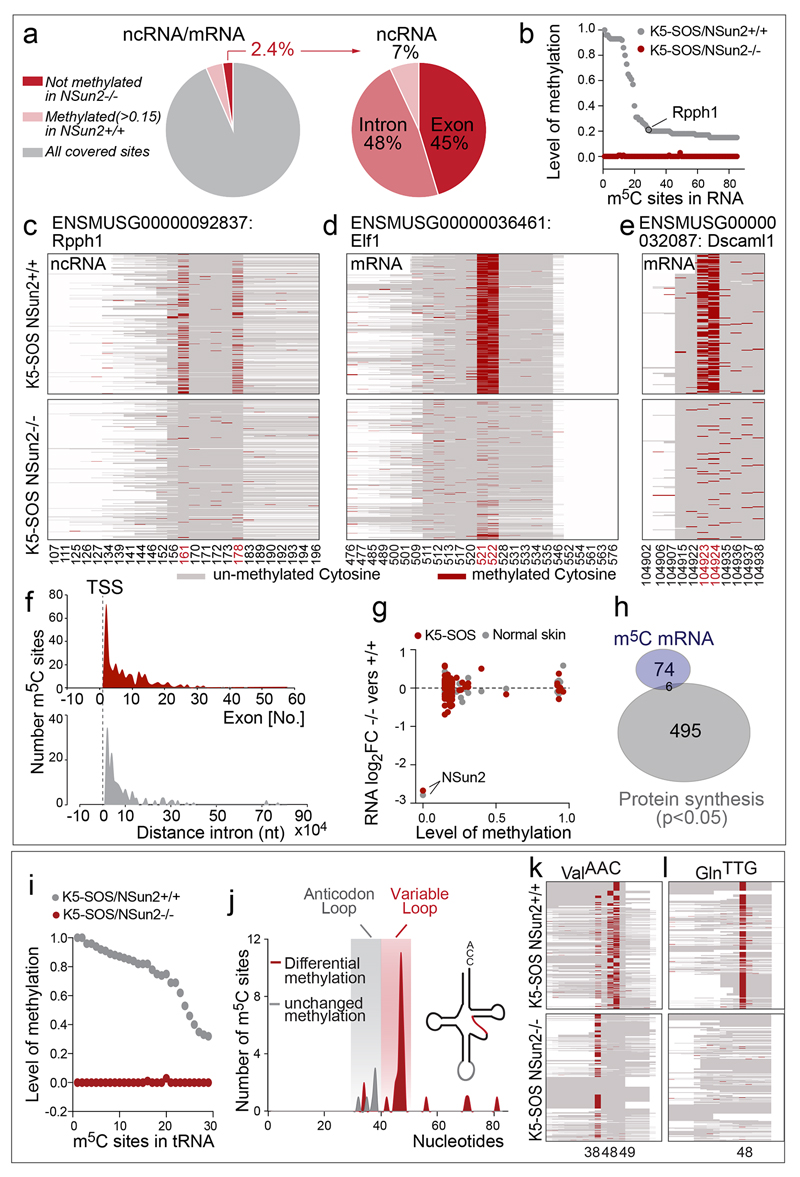
Extended data Figure 7. NSun2-dependent RNA methylation of coding and non-coding RNA in tumours.
a, Percentage of NSun2-methylated sites (>0.15 m5C in NSun2+/+; <0.05 m5C in NSun2-/-) out of all covered sites (left hand panel) and in non-coding RNA (ncRNA) or introns and exons (right hand panel). b, Methylation level in coding and non-coding RNAs (>0.15 m5C in NSun2+/+; <0.05 m5C in NSun2-/-; coverage >10 reads). c-e, Examples of NSun2-targeted non-coding RNA (Rpph1) and mRNA (Elf1 and Dscaml1) in NSun2+/+ (upper panels) and NSun2-/- (lower panels) tumours. f, Number of NSun2-methylated sites in exons 1 to 60 (upper panel) or distance from the transcriptional start site (TSS) in introns (lower panel). Plotted sites: >0.1 m5C in NSun2+/+; <0.05 m5C in NSun2-/-; coverage >10 reads. g, No correlation between NSun2-methylation shown in (b) and RNA abundance in normal skin or K5-SOS skin tumours. NSun2 is highlighted as a control. h, Venn diagram with no significant overlap between NSun2- methylation targets shown in (b) and differentially translated mRNAs (p<0.05; measured as ribosome density of NSun2+/+ versus NSun2-/- tumours). i-l, NSun2-methylation in tRNAs (>0.15 m5C in NSun2+/+; <0.05 m5C in NSun2-/-; coverage >10 reads) (i). Number and location of lost (red) or unchanged (grey) m5C sites in NSun2-/- K5-SOS tumours. X-axis: nucleotide position in tRNA (j). Examples of NSun2-targeted tRNAs in NSun2+/+ (upper panels) and NSun2-/- (lower panels) K5-SOS tumours (k,l). Heat maps show methylated (red) and un-methylated (grey) cytosines. X-axis: cytosines. Y-axis: sequence reads. Numbers indicate the m5C position in the RNA (c-e;k,l). Bisulphite-seq and RNA-seq data represent average of 4 replicates per condition.

