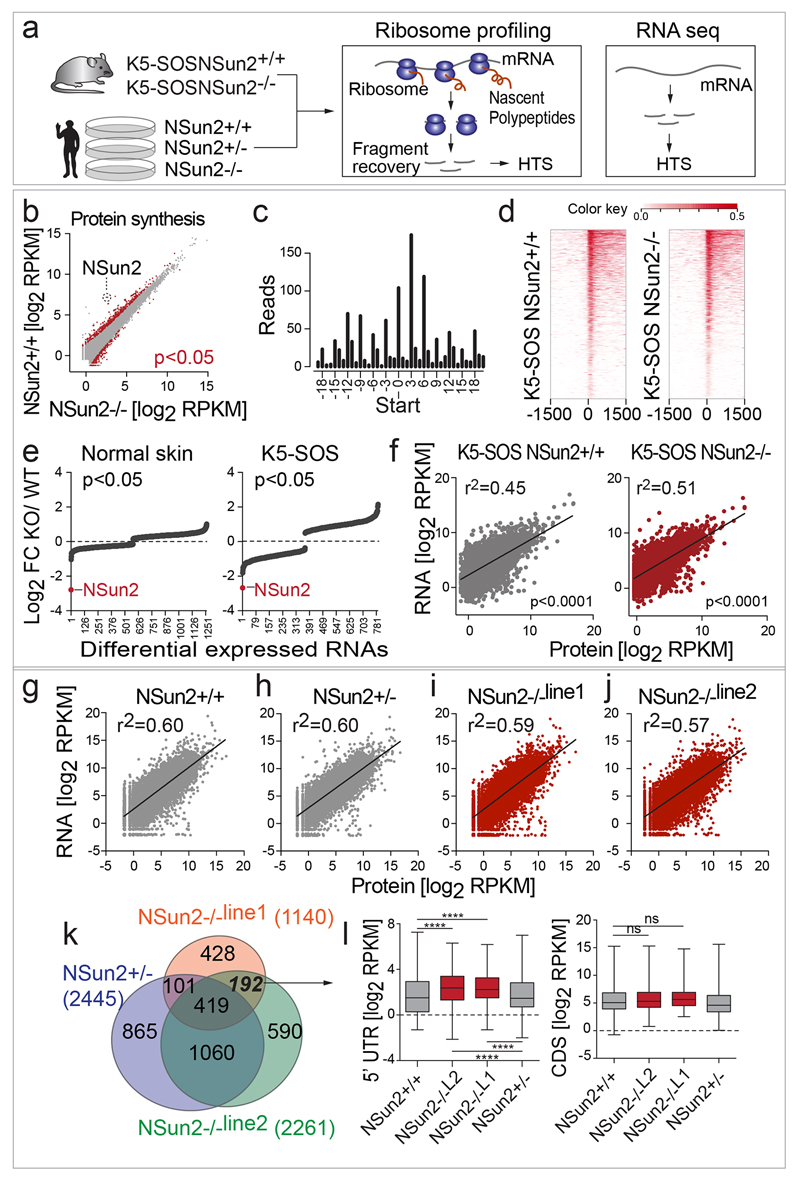
Extended data Figure 8. NSun2- deletion drives translational changes independent of mRNA expression.
a, Ribosome profiling and RNA sequencing experiments (see Figure 5) using NSun2-expressing (NSun2+/+) and NSun2-deficient (NSun2-/-) K5-SOS skin tumours, or cultured human skin fibroblasts (NSun2-/-Line1 and Line2 and healthy donors: NSun2+/-, NSun2+/+). HTS (High Throughput Sequencing). b, Correlation between protein synthesis (ribosome footprint density) in NSun2+/+ and -/- tumours. c, Example of triplet periodicity in ribosome footprints (K5-SOS/NSun2+/+, replicate 1) shown as number of reads against nucleotide position relative to the translation start site for all open reading frames. d, Heat maps showing ribosome footprint reads around the translational start site (0) in NSun2+/+ and NSun2-/- tumours (3 replicates per condition; ribosome density > 0; colour: RPKM values of footprints). e, Log2 fold-change (FC) per transcript in normal skin (left hand panel) and tumour samples (right hand panel) of significant (p<0.05) expression differences. NSun2 RNA levels (red). f-j, Scatter plots, linear regression lines and coefficient of correlation (r2) of mRNA expression and protein synthesis (density of ribosome footprints per kb) in NSun2+/+ (grey) and -/- (red) mouse tumours (f) and human fibroblasts (g-j). k, Venn diagram of transcripts with significant (p<0.05) different ribosome footprint density in the 5’UTR in NSun2+/-, NSun2-/-line1 and NSun2-/-line2 human fibroblasts relative to NSun2+/+ cells. l, Box plots of ribosome footprint read counts in the 5’UTR (left hand panel) and corresponding CDS (right hand panel) of the 192 transcripts in (k). ****p<0.0001 (two-tailed Student’s t-test).

