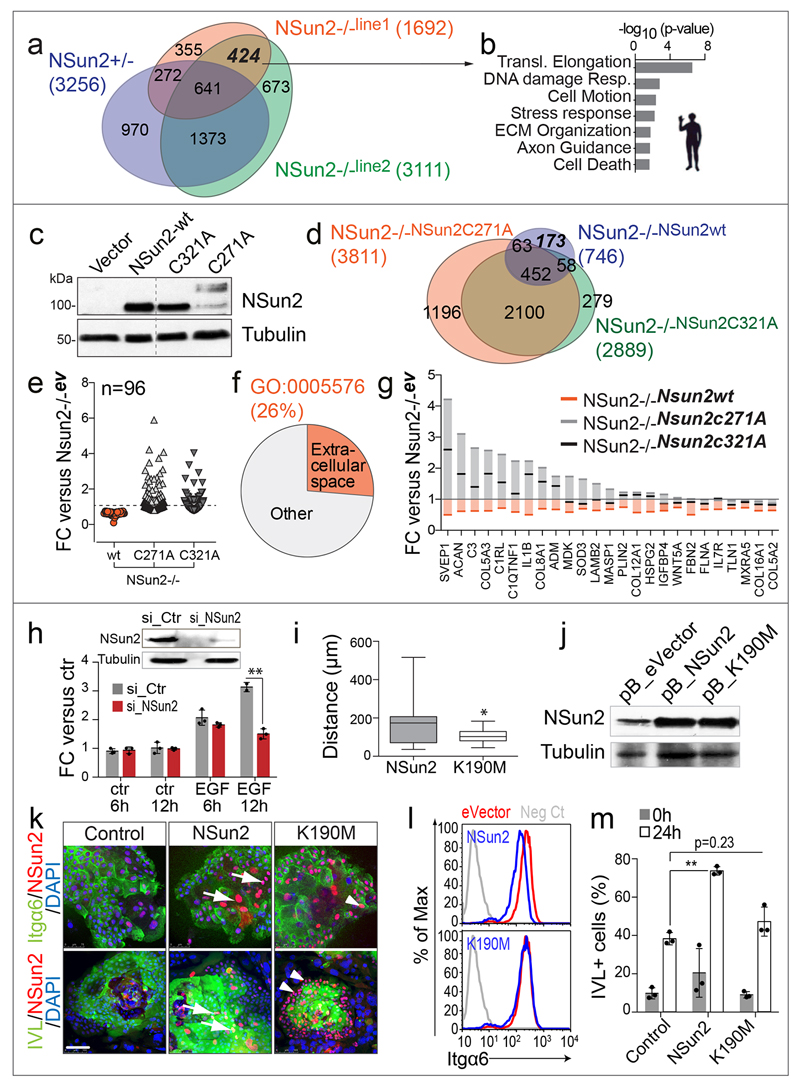
Extended data Figure 9. RNA methylation-dependent changes of protein synthesis.
a, Venn diagram of transcripts with differential protein synthesis in NSun2+/- and NSun2-/- human fibroblasts relative to NSun2+/+ cells. b, GO terms enriched in 424 commonly differentially translated transcripts in NSun2-/- lines (a). c, Western blot for NSun2 and tubulin in NSun2-/- human fibroblasts rescued with viral constructs expressing wild-type NSun2 (NSun2-wt), two catalytically dead mutants (C271A and C321A) or the empty vector. d, Venn diagram of differentially translated genes in the indicated rescued cells relative to empty vector-infected control cells. Translation of 173 out of 746 of transcripts (23%) depended on the enzymatic activity of NSun2. e-g, Differential translation of transcripts relative to NSun2-/- cells (infected with empty vector) showing reduced translation in the presence of wild-type (wt) NSun2 but not the enzymatic-dead versions of NSun2 (C271A, C321A), corresponding GO categories (f) and examples (g). h, Boyden chamber migration assay towards epidermal growth factor (EGF) or control medium (ctr) using primary human keratinocytes transduced with a siRNA for NSun2 (si_NSun2) or a scrambled construct (si_ctr). Data represent mean ± s.d. (n=3 assays). Western blot confirms down-regulation of NSun2 in the presence of the siRNA construct. i, j Reduced motility in keratinocytes expressing the enzymatic-dead NSun2 construct (K190M) (K190M: n=13; NSun2: n=19 cells) (i). Western Blot confirms equal protein expression levels of K190M and NSun2 (j). k, Reduced differentiation in primary human keratinocytes expressing the enzymatic-dead NSun2 (K190M). Staining for NSun2, Itgα6 or Involucrin (IVL) and nuclei (DAPI). Control: empty vector (left hand panels); NSun2: wild-type NSun2 (middle panels), K190: enzymatic-dead NSun2 (right hand panels). Arrows: NSun2-expressing Itgα6-/IVL+ cells. Arrowheads: K190M-expressing Itgα6+/IVL- cells. l, Flow cytometry for Itgα6 of keratinocytes transduced with NSun2 (blue line, upper panel), K190M (blue line, lower panel) or the empty vector (eVector) (red line). Negative control (grey line) represents unstained cells. m, Quantification of IVL+ infected keratinocytes grown in suspension for 24 hours to stimulate differentiation. *p<0.05; **p<0.01 (two-tailed Student’s t-test) (h-m). Scale bar: 100 μm. Source data: SI_EDF9.

