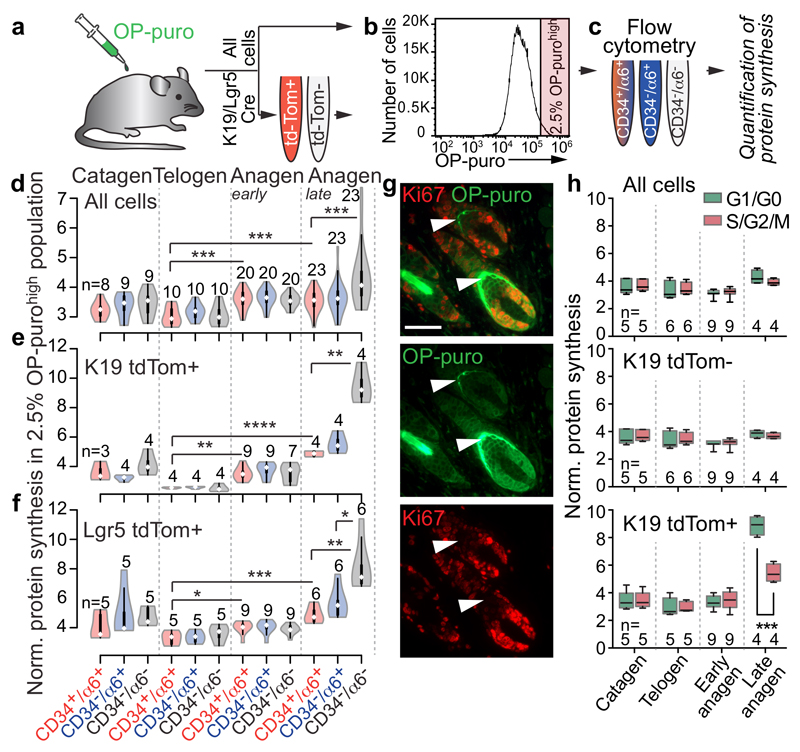
Figure 2. Protein synthesis correlates with differentiation.
a-c, Experimental set up. d-f, Violin plots of normalized protein synthesis in OP-purohigh cells sorted for indicated epidermal populations (c). Itgα6: α6. g, Ki67 and OP-puro detection (late anagen). Arrowheads: Ki67-/OP-puro+ cells. Scale bar: 50 μm. h, Box plots of protein synthesis in cycling (S/G2/M) and non-dividing (G1/G0) OP-purohigh cells. n=mice. *p<0.05, **p < 0.01, ***p < 0.001, ****p<0.0001 (Two-tailed Student’s t-test). Source data: SI_Fig2.

