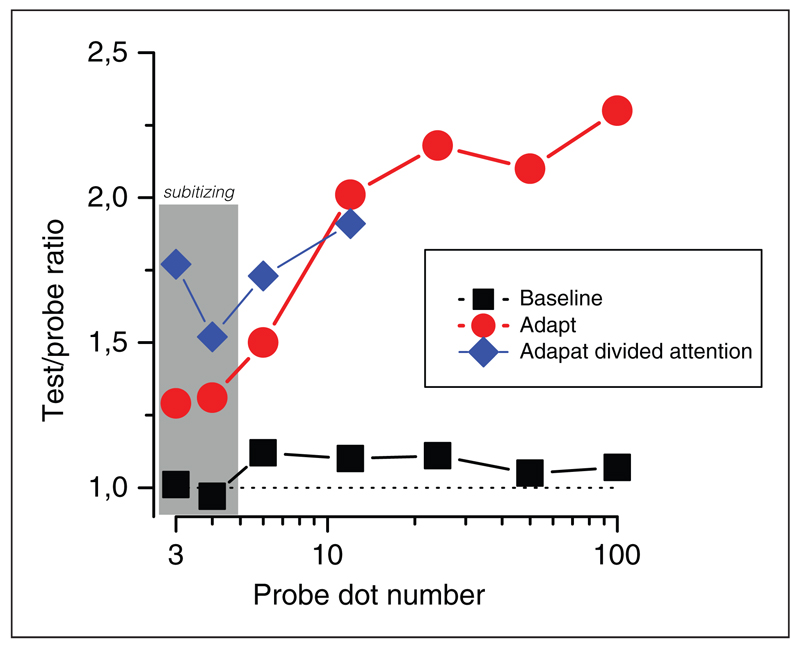
Figure I. Numerosity adaptation.
Magnitude of adaptation (expressed as a ratio of number of dots in the test patch to that in the probe) as a function of number of dots in the probe. Red circles show standard results with a single task, blue diamonds results when attention was deprived with a demanding conjunction task. Black squares show baseline performance with no adaptation or attentional load. Values above the unity line (dashed) indicate underestimation after adaptation to a high numerosity (400). The gray shading indicates probes in the subitizing range (discussed later). Reproduced with permission from Burr and Ross (2008) and Burr, Anobile, and Turi (2011).

