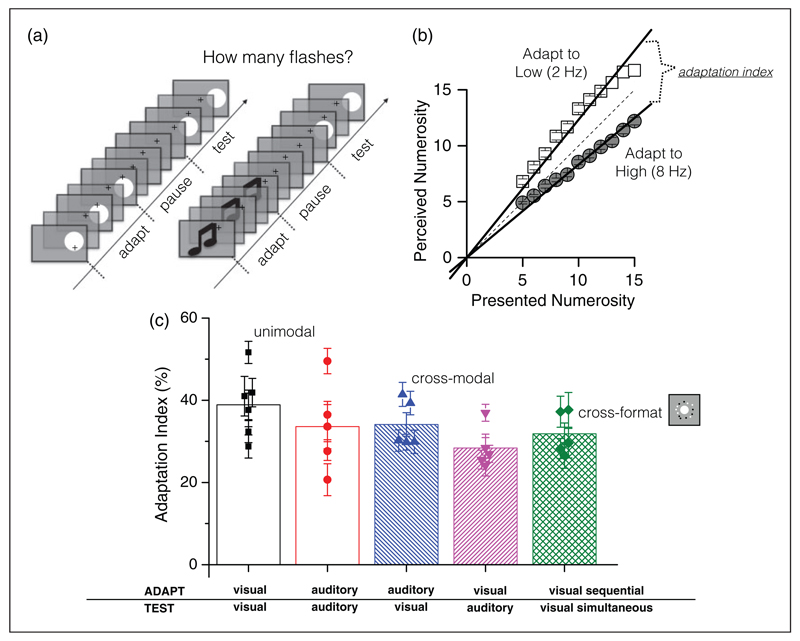
Figure 2. Cross-modal, cross-format numerosity adaptation.
(a) Examples of stimuli for the serial number adaptation, visual unimodal (at left), and auditory-visual cross-modal (at right). (b) Sample results in the visual unimodal adaptation task. Adapting to low numbers (2 Hz, open squares) produces an overestimation of numerosity, and adaption to high numbers (8 Hz, gray circles) and underestimation. Data were well-fitted with linear regressions (lines on the data) constrained to pass throughout zero, and the strength of the adaptation effect (adaptation index) given by the difference in slope of the regression lines. (c) Mean adaptation indexes for the various experimental conditions: uni-modal visual and auditory adaptation; cross-modal auditory-visual and visual-auditory adaptation; and “cross-format” adaptation (adapt to serial presentation, test with simultaneous). Bars show average data, symbols single subject data). Adapted with permission from Arrighi et al. (2014).

