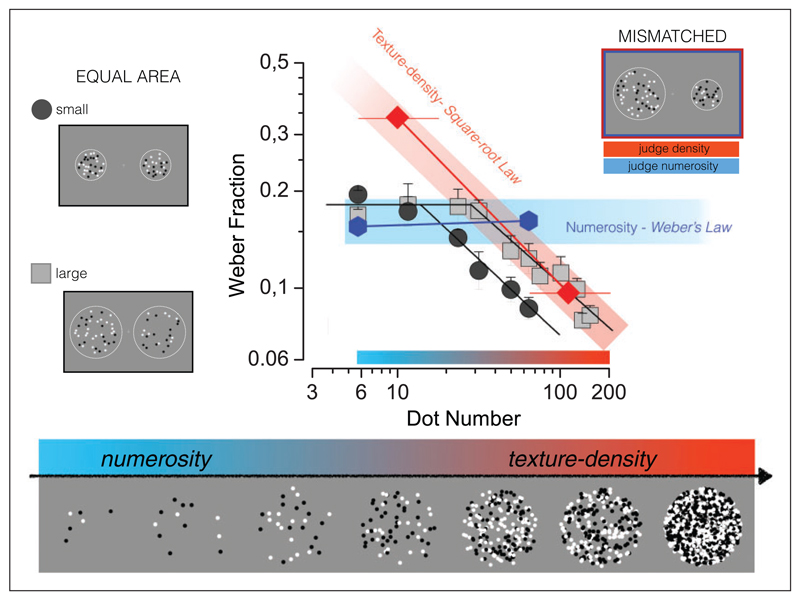
Figure 6. Different sensory thresholds for numerosity and texture density discrimination.
Weber Fractions as a function of dot number, for two different stimulus areas of test and probe. Dark gray circles refer to test and probe stimuli confined in small circular areas (8° diameter), light gray squares to large areas (14° diameter), for numerosity discriminations. Weber fractions in both areas conditions remain constant up to a critical numerosity, then start to decrease, with a slope of −0.5, consistent with a square-root relationship. The blue hexagons show thresholds for discriminating numerosity in the unequal-area condition, red diamonds density discriminations for unequal areas. Adapted with permission from Anobile et al. (2014).

