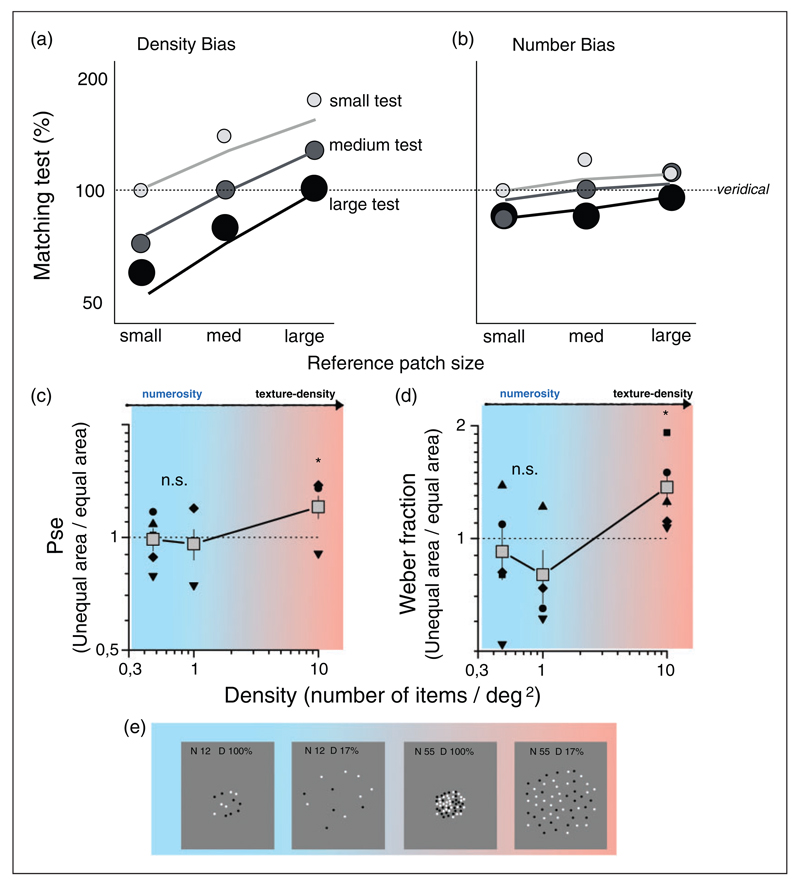
Figure 8. Effect of area mismatching on numerosity discrimination.
(a and b) Biases in the PSE reported by Dakin, Tibber, Greenwood, Kingdom, and Morgan (2011), as a function of reference patch size for three levels of the test sizes (light-gray small, mid-gray medium, and black large) for density (a) and number (b) discrimination. Horizontal dashed lines indicate no bias. The data show clear size-dependent biases in estimation of density and smaller dependence for numerosity. (c and d) Testing the bias at different stimulus densities. (e) Examples of stimuli of different density. Stimuli were presented centered at 13° left and right of central fixation point. The probe numerosity was kept fixed, in separate sessions at N = 6 (0.47 dots/deg2), 12 (0.95 dots/deg2), or 128 (10.18 dots/deg2) dots. Test stimuli varied according subjects’ responses following the QUEST algorithm. In the equal-area condition, probe and test areas were both 113 deg2. In the unequal area, condition probe area was reduced to 12.56 deg2. (c) Accuracy biases expressed as the ratio of PSE measured in the unequal- to the equal-area condition, as a function of density. Values above one indicate overestimation of the larger stimulus. (d) Precision biases measured as the ratio of Weber Fraction measured in the unequal- and equal-area conditions. Values above one indicate worse precision in the area-mismatched conditions. T test reveals statistically significant effect (t(4) = 2.37, p < .05) of mismatch area on both PSE and Weber Fraction only for highest tested density (N = 128, 10.18 dots/deg2). Adapted with permission from Dakin et al. (2011).

