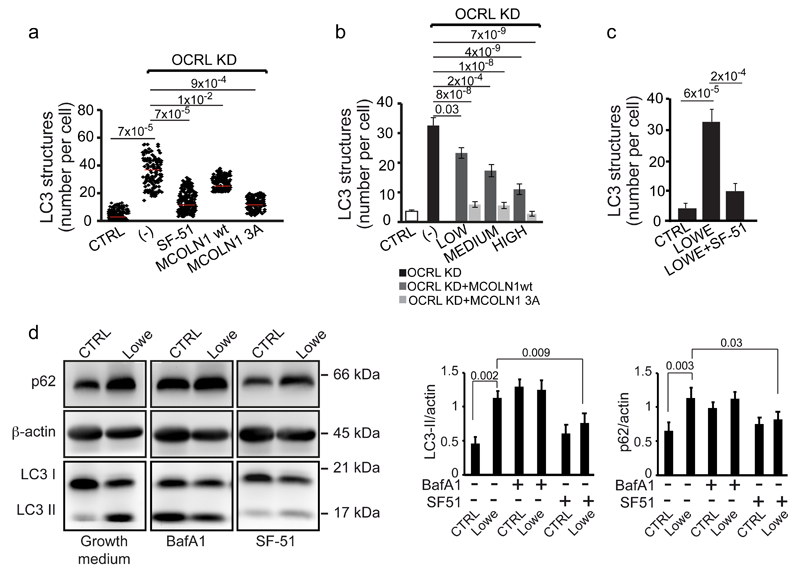
Figure 8. Autophagy flux is rescued by boosting MCOLN1 activity in OCRL-depleted cells and in Lowe syndrome patient PTCs.
(a) Quantification of LC3-positive structures in control, OCRL KD cells (-), OCRL-KD cells incubated in serum-free medium with 200 μM of the MCOLN1 agonist SF-51, or transfected with wt or a mutant form (MCOLN1-3A) of MCOLN1 that is PI(4,5)P2-insensitive44. Red line indicates mean values ± s.d. n=200 cells per condition pooled from 4 independent experiments. (b) Quantification of LC3-positive structures in control, OCRL KD (-), or OCRL-KD cells expressing different levels (low, medium and high) of wt MCOLN1 or MCOLN1-3A. Values are means ± s.d., n=75 cells per condition pooled from 5 independent experiments. (c) Quantification of the number of LC3-positive structures in CTRL PTCs, Lowe Syndrome PTCs, and Lowe Syndrome PTCs treated with 200 μM of the MCOLN1 agonist SF-51 for 2 hours. Means ± s.d. n=102 (CTRL), n=84 (Lowe), n=106 (Lowe + SF-51) cells pooled from 3 independent experiments. p-values calculated by One-way ANOVA with Tukey's post hoc test. Statistic source data can be found in Supplementary Table 2. (d) Cell lysates (50 μg/sample) from CTRL and Lowe syndrome PTCs incubated in growth medium or treated with 100 nM Bafilomycin A1 (Baf A1) or with 200 μM of the MCOLN1 agonist SF-51 for 2 hours were analyzed by SDS-PAGE and immunodetected with the indicated antibodies. β-actin was used as a loading control. A representative blot is shown and an unprocessed scan of the blot is shown in Supplementary Fig. 9. The data in both graphs on the right are mean values ± s.d., n=6 lysates per condition pooled from 6 independent experiments. P-values calculated by Student's t-test. Statistic source data can be found in Supplementary Table 2.

