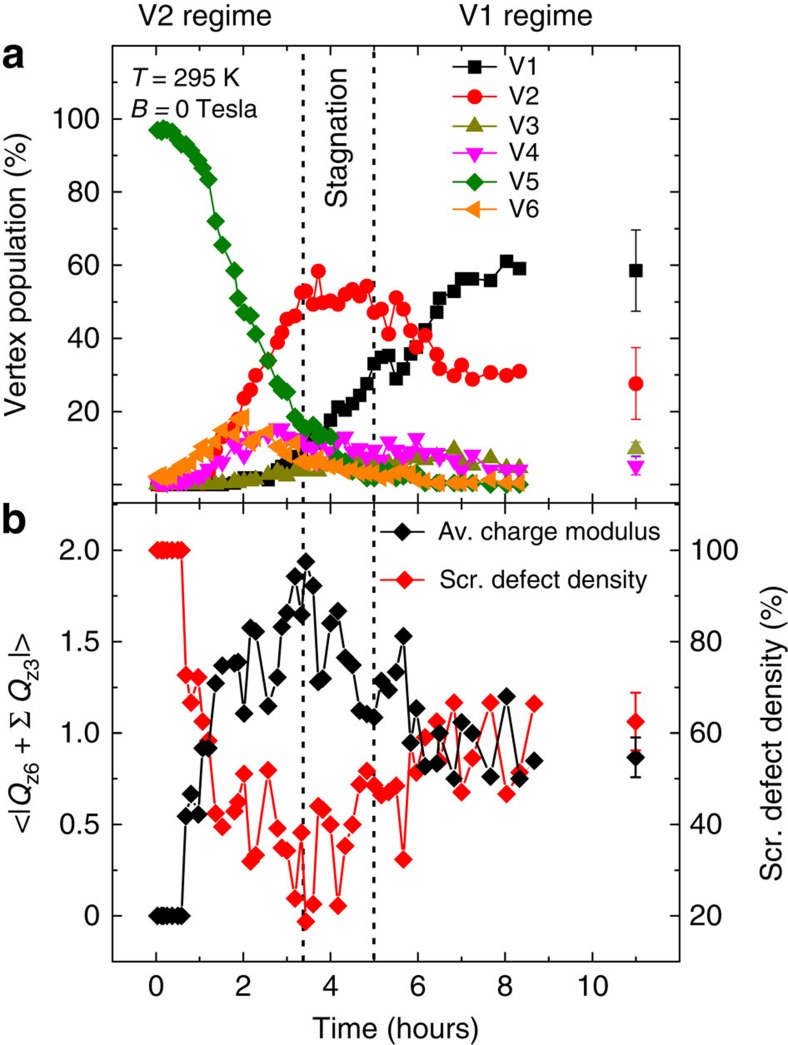
Figure 3. Thermal relaxation of the dipolar dice lattice.
(a) Temporal evolution of vertex-type population at z6 sites at T=295 K. Starting from a fully saturated state (100% V5 vertex population), the system relaxes via thermally-driven moment re-orientations in the patterned nanomagnets. The relaxation process involves three distinct regimes: the V2-regime marked by a strong initial increase in V2 vertices, followed by the stagnation regime in which the V2-vertex population remains constant, and, finally, the V1-regime where the population of V1 vertices rises at the expense of all other vertex types. The system approaches its low-energy equilibrium configuration in the V1 regime after 11 h. (b) Average charge modulus  plotted as a function of time (black diamonds) together with the corresponding density of screened magnetic charges (red diamonds). In equilibrium, by recording image sequences, consisting of ten images per sequence, we determine the average equilibrium vertex populations, charge modulus and screened defect density with respective standard deviations given as error bars.

