
Figure 1.
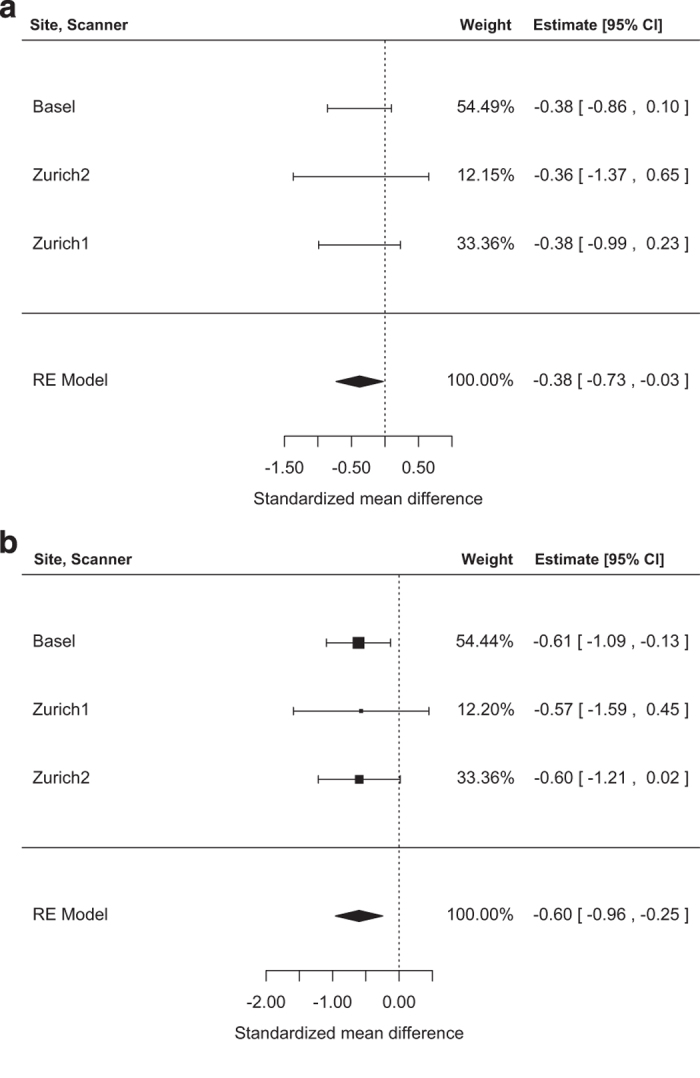
Forest plot of prospective, random effects meta-analyses investigating the difference between: (a) hippocampal volumes and group affiliation. (b) Thalamic volumes and group affiliation. Negative values represent smaller volumes for CHR than in HC. The dashed line is the zero line of no difference between groups.