. 2016 Aug 20;5:e17877. doi: 10.7554/eLife.17877

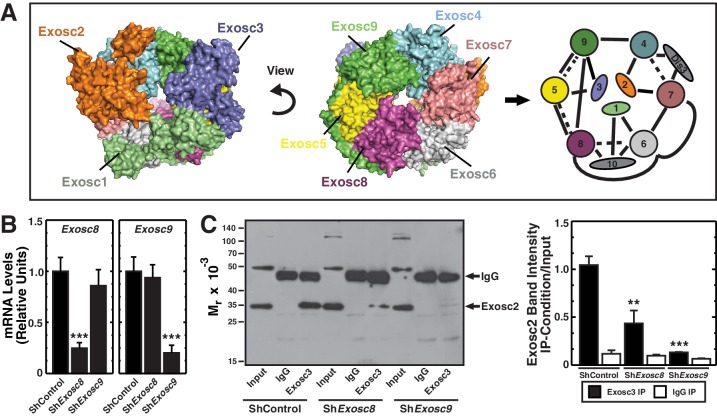
Figure 1. Exosc8 or Exosc9 downregulation disrupts protein-protein interactions within the exosome complex.

(A) Crystal structure and model of the human exosome complex (Liu et al., 2006). Solid line, direct interactions; Dashed line, indirect interactions. (B) Real-time RT-PCR analysis of mRNA expression (mean ± SE, 3 independent replicates) in G1E-ER-GATA-1 cells 48 hr post-infection with either Exosc8 or Exosc9 shRNA expressing retrovirus. Values normalized to 18S expression and relative to the control. (C) Left: representative image of a semi-quantitative Western blot of Exosc2 co-immunoprecipitated with anti-Exosc3 antibody in G1E-ER-GATA-1 whole cell lysates prepared 48 hr post-Exosc8 or Exosc9 knockdown. Right: densitometric analysis of band intensity relative to the input for each knockdown condition (mean ± SE, 3 independent replicates). Statistical analysis of control and treatment conditions was conducted with the Student’s T-test. *p<0.05, **p<0.01, ***p<0.001. Source data is available in Figure 1—source data 1.

DOI: http://dx.doi.org/10.7554/eLife.17877.003

Figure 1—source data 1. This Excel spreadsheet contains the values of each independent replicate for data presented as histograms (mean ± SE) in Figure 1.
Sheet 1: Figure 1B mRNA expression of Exosc8 and Exosc9 normalized to 18S. Sheet 2: Figure 1C densitometric analysis of Exosc2 immunoblots (pull down/input) from an Exosc3 immunoprecipitation 48 hr after Exosc8 or Exosc9 knockdown.
DOI: 10.7554/eLife.17877.004

Figure 1.

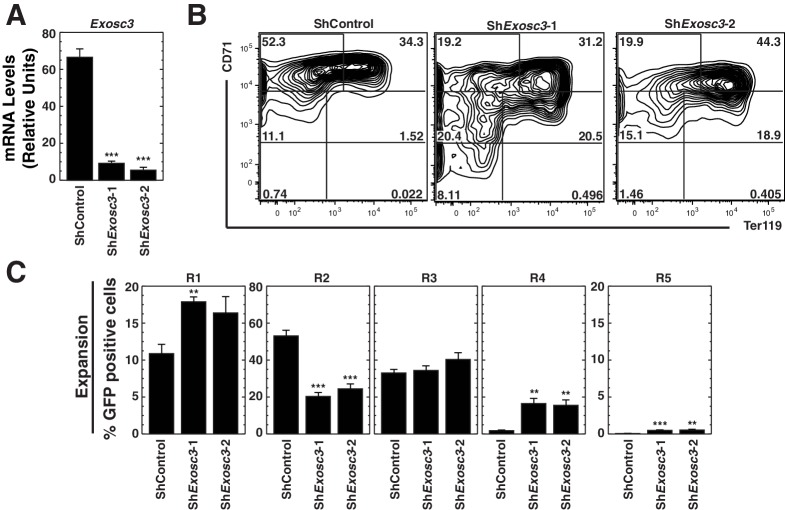
Figure 1—figure supplement 1. The RNA binding exosome complex component Exosc3 suppresses erythroid maturation.

Figure 1—figure supplement 1.

(A) qRT-PCR analysis of Exosc3 mRNA in primary erythroid precursor cells 72 hr post-infection with shRNA-expressing retrovirus (mean ± SE, 5 biological replicates). Values are normalized to 18S expression and relative to the control. (B) Erythroid maturation analyzed by flow cytometric quantitation CD71 and Ter119 staining 72 hr post-Exosc3 knockdown in primary erythroid precursor cells. Representative flow cytometry plots, with the R1-R5 gates denoted (5 biological replicates). (C) Percentage of primary erythroid precursor cells in R1-R5 populations 72 hr after Exosc3 knockdown (mean ± SE, 5 biological replicates). Statistical analysis of control and treatment conditions was conducted with the Student’s T-test. *p<0.05, **p<0.01, ***p<0.001.