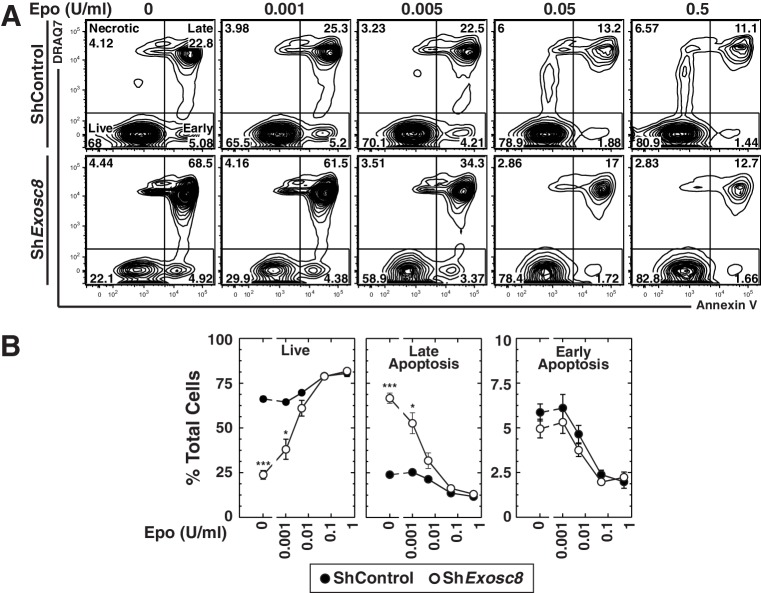
Figure 2. Exosome complex disruption renders primary erythroid cells hypersensitive to limiting erythropoietin concentrations.
(A) Flow cytometric analysis with Annexin V and the membrane-impermeable dye DRAQ7 to quantitate apoptosis with control and Exosc8-knockdown primary erythroid cells expanded for 48 hr under Epo-limiting conditions. (B) Quantification of the percentage of primary erythroid cells in live, late and early apoptotic populations (mean ± SE, 4 biological replicates). Statistical analysis of control and treatment conditions was conducted with the Student’s T-test. *p<0.05, **p<0.01, ***p<0.001. Source data is available in Figure 2—source data 1.
DOI: http://dx.doi.org/10.7554/eLife.17877.006

