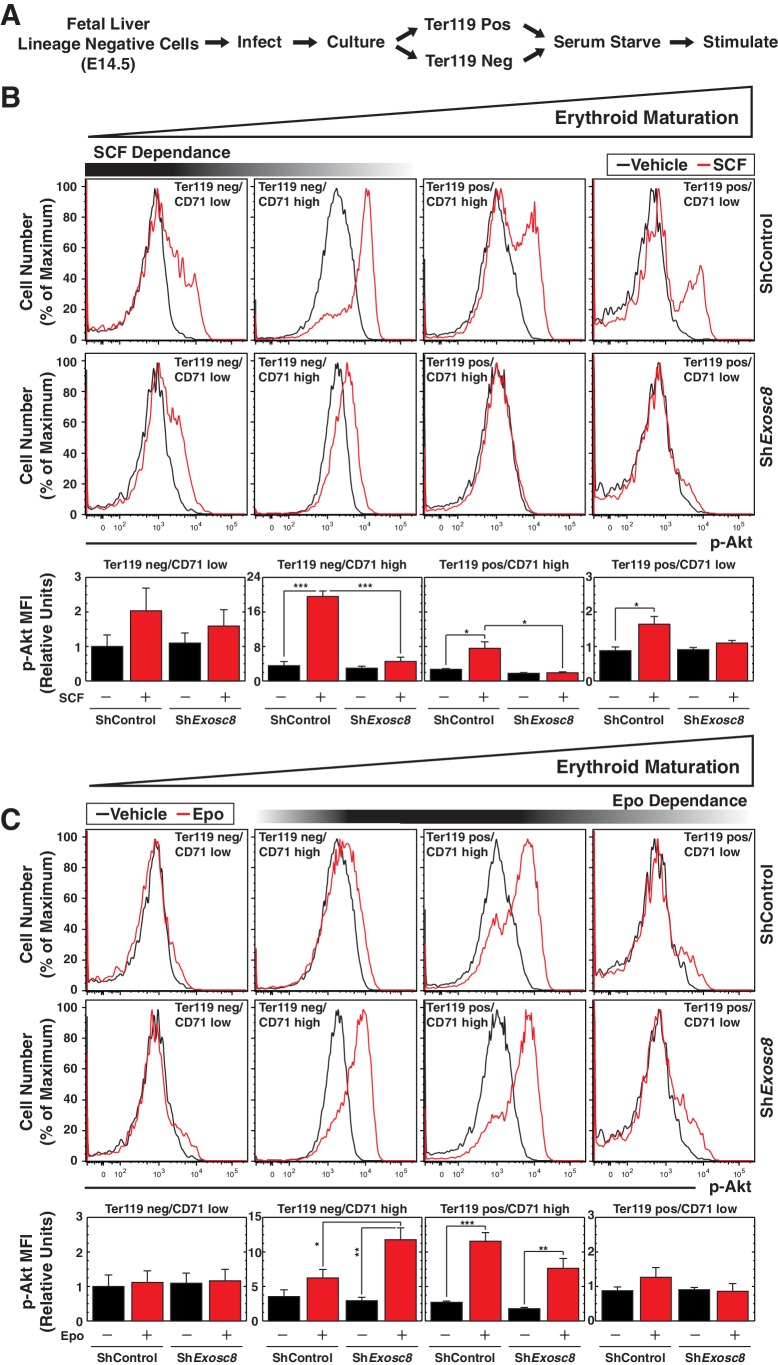
Figure 4. Exosome complex sustains proliferation signaling, while suppressing pro-differentiation signaling.
(A) Experimental scheme: lineage-negative cells were isolated from E14.5 fetal livers, and infected with luciferase or Exosc8 shRNAs. Cells were cultured for 48 hr and sorted into Ter119+ and Ter119- populations using beads. After 1 hr of serum-starvation, cells were stimulated for 10 min with 10 ng/ml SCF or 2 U/ml Epo and fixed/permeabilized before staining for CD71 and p-Akt. (B) Top: p-Akt staining after stimulation with 10 ng/ml SCF in control and Exosc8-knockdown cells (6 biological replicates). Bottom: Relative p-Akt MFI after stimulation with 10 ng/ml SCF in control and Exosc8-knockdown cells. MFI expressed relative to unstimulated Ter119-/CD71low control (mean ± SE, 6 biological replicates). (C) Top: p-Akt staining after stimulation with 2 U/ml EPO in control and Exosc8-knockdown cells (6 biological replicates). Bottom: Relative p-Akt MFI after stimulation with 2 U/ml Epo in control and Exosc8-knockdown cells. MFI expressed relative to unstimulated Ter119-/CD71low control (mean ± SE, 6 biological replicates). ANOVA identified any significant variation within the experiment, and a Tukey-Kramer test identified the statistical relationship between each pair of samples. *p<0.05, **p<0.01, ***p<0.001. Source data is available in Figure 4—source data 1.
DOI: http://dx.doi.org/10.7554/eLife.17877.011


