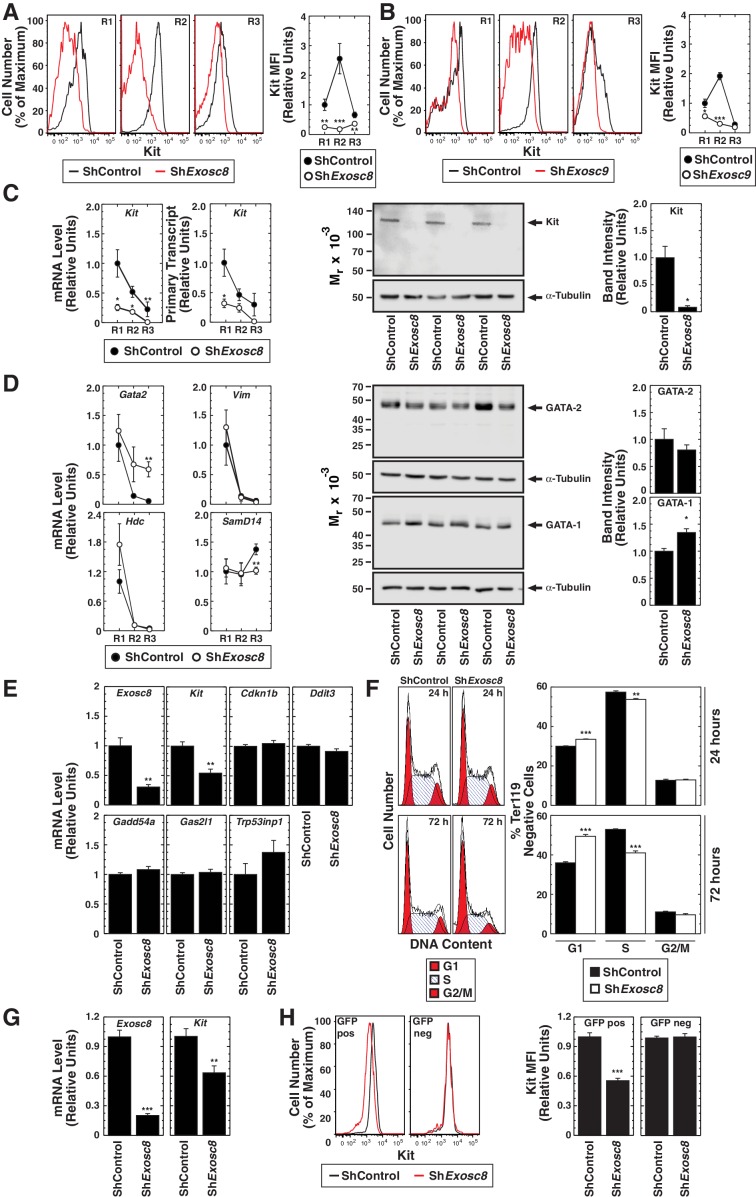
Figure 5. Exosome complex requirement for Kit expression.
(A) Left: surface Kit in R1-R3 populations 48 hr post-Exosc8 knockdown. Representative plots. Right: surface Kit MFI relative to control R1 (mean ± SE, 5 biological replicates). (B) Left: surface Kit in R1-R3 cells 48 hr post-Exosc9 knockdown. Representative plots. Right: surface Kit MFI relative to control R1 (mean ± SE, 8 biological replicates). (C) Left: real-time RT-PCR of Kit mRNA and primary transcripts in sorted R1-R3 populations 72 hr post-infection with shControl or shExosc8 normalized to 18S and relative to control R1 (mean ± SE, 6 biological replicates). Middle: Kit Western blot with Ter119- cells 24 hr post-infection (mean ± SE, 3 biological replicates). (D) Left: real-time RT-PCR of erythroid mRNAs in sorted R1-R3 populations 72 hr post-infection with shControl or shExosc8 (mean ± SE, 6 biological replicates). Middle: GATA-2 and GATA-1 Western blot with Ter119- cells 24 hr post-infection. Right: densitometric analysis normalized to tubulin and relative to shControl (mean ± SE, 3 biological replicates). (E) qRT-PCR of Exosc8 and Kit mRNA and GATA-1/Exosc8-regulated cell cycle arrest genes in primary erythroid precursor cells 24 hr post-infection. Normalized to 18S and relative to the control (mean ± SE, 5 biological replicates). (F) Cell cycle analysis of control and Exosc8-knockdown Ter119- cells 24 (top) and 72 hr (bottom) post-infection (mean ± SE, 6 biological replicates) (G) qRT-PCR analysis of Exosc8 and Kit mRNA in G1E cells 48 hr post-infection with shControl or shExosc8 retrovirus, normalized to 18S and expressed relative to the control (mean ± SE, 3 independent experiments) (H) Cell surface Kit expression in infected (GFP+) and uninfected (GFP-) populations of G1E cells 48 hr post-infection with shExosc8 (mean ± SE, 3 independent experiments). Statistical analysis of control and treatment conditions was conducted with the Student’s T-test *p<0.05, **p<0.01, ***p<0.001. Source data is available in Figure 5—source data 1.
DOI: http://dx.doi.org/10.7554/eLife.17877.014

