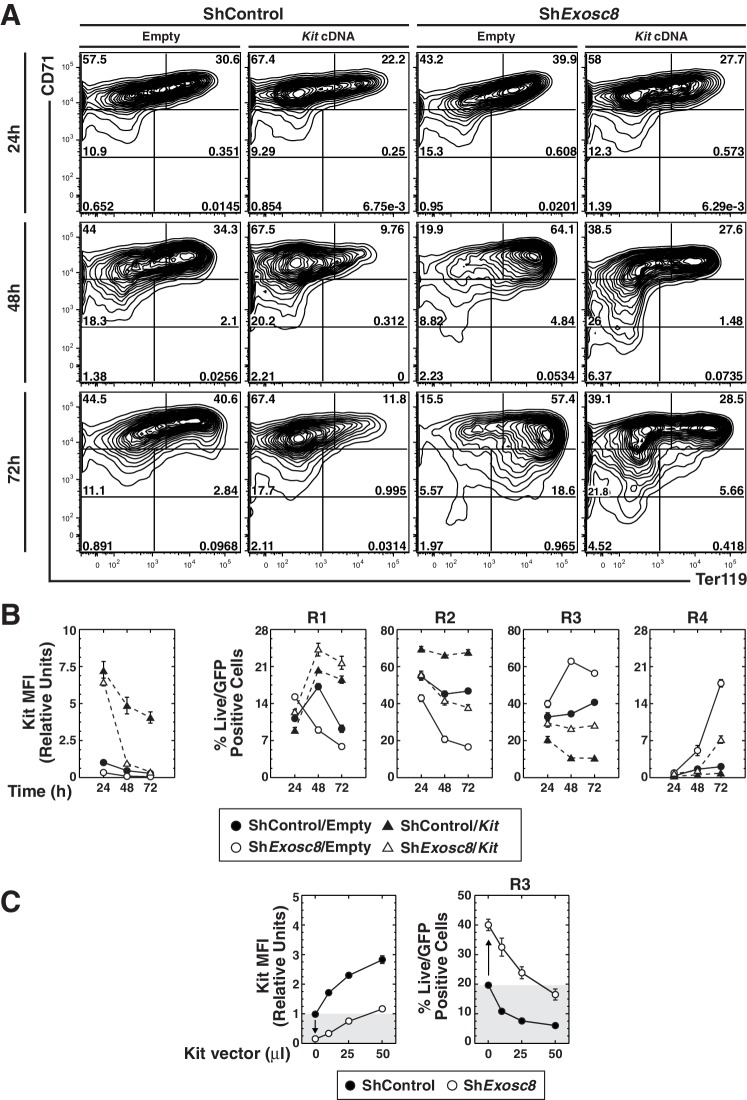
Figure 7. Functional link between Kit downregulation and erythroid differentiation induced by disrupting the exosome complex.
(A) Erythroid maturation analyzed by flow cytometric quantitation of CD71 and Ter119 post-Exosc8 knockdown and/or Kit expression in primary erythroid precursor cells expanded for 72 hr. Representative flow cytometry plots, with the R1-R5 gates denoted. (B) Left: relative Kit MFI post-Exosc8 knockdown and/or Kit overexpression (mean ± SE, 4 biological replicates). Right: percentage of primary erythroid precursor cells in the R1-R4 gates (mean ± SE, 4 biological replicates). (C) Left: relative Kit MFI 48 hr post-Exosc8 knockdown in cells infected with increasing amounts of a Kit-expressing retrovirus. The arrow depicts Kit downregulation resulting from knocking-down Exosc8. Right: percentage of erythroid precursor cells in the R3 population 48 hr post-infection with shExosc8 in cells infected with increasing amounts of Kit-expressing retrovirus. The arrow depicts the increased R3 population post-Exosc8 knockdown. ANOVA identified any significant variation between experimental groups then a Tukey-Kramer test identified the statistical relationship between each pair of samples, *p<0.05, **p<0.01, ***p<0.001. Source data is available in Figure 7—source data 1
DOI: http://dx.doi.org/10.7554/eLife.17877.018

