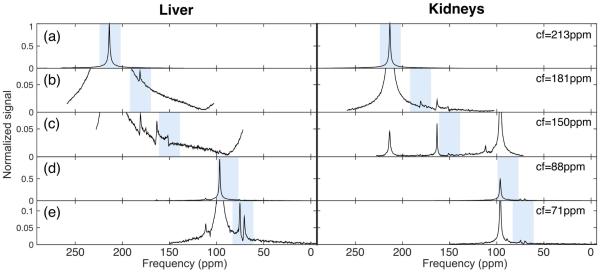
Figure 4.
13C-MRS acquired using the multi-frequency shifts method on a 2-cm slab on the liver and a 2-cm slab on the kidney. The RF pulse excitation bandwidth was 694.4 Hz (21.6ppm), whilst the acquisition bandwidth was 5 KHz (155.8ppm), centered on the frequency offset specified on the right of the image. The shaded areas highlight the excitation band on the center of the prescribed slab. Misregistered resonances can be seen outside the shaded area. The following flip angles were applied on each band: (a) 5°, (b,d,e) 20°, and (c) 30°. Signal was normalized to the DHAc peak in (a). Data shown is the sum of the first five dynamic spectra.

