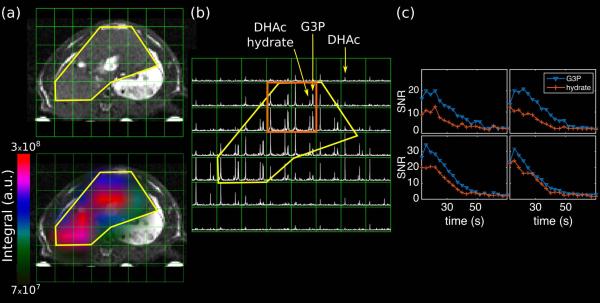
Figure 6.
Axial 2D MRSI of the liver. (a) A 3D balanced-SSFP 1H image is shown for anatomic reference, and on the bottom is the same image with the G3P metabolite map overlayed on it. The liver contour is delineated in yellow, highlighting that metabolism of DHAc occurs mainly inside this organ. (b) Axial 2D 13C-MRSI acquired 12 s after the start of the injection of hyperpolarized [2-13C]DHAc into a fasted rat using the same SPSP RF pulse as in Figure 5. Acquisition parameters: slab thickness = 2 cm, matrix = 8 × 8, FOV = 8 × 8 cm2, 10° flip angle calibrated at the transmitter frequency offset −2895 Hz. (c) Dynamic curves of the SNR of G3P and DHAc hydrate from the four voxels highlighted in orange.

