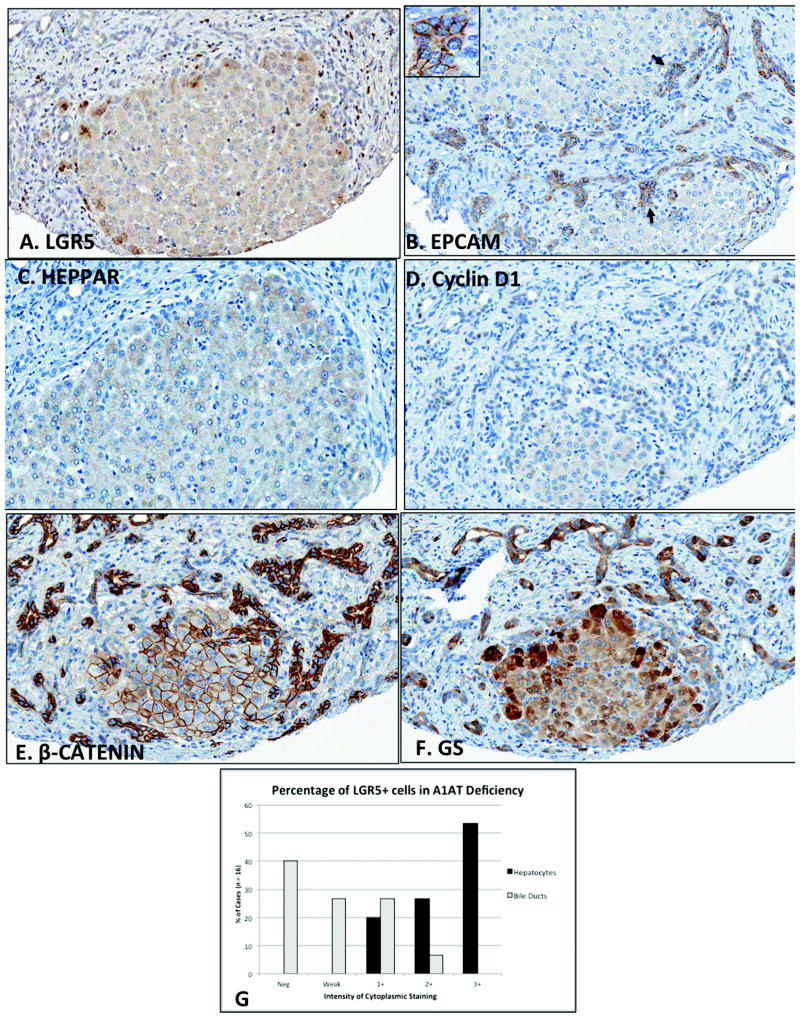
Figure 5. Peri-septal localization of LGR5 in human A1ATD.
LGR5+ cells (A) stain intensely at the perimeter of regenerative nodules, with majority of staining localizing to hepatocytes (labeled by Hep Par staining in C) compared to bile ducts. EPCAM+ biliary cells can be seen extending into regenerative clusters as fine tubules intercalating with small hepatocyte buds (B, arrows and inset). Cyclin D1 staining identifies actively proliferating biliary cells in areas of fibrosis (D). Strong membranous β-catenin staining is observed in the center of the nodule, with cytoplasmic β-catenin staining at the periphery (E). Glutamine synthetase-positive cells also stain more intensely at the periphery of the nodules (F). Unlike LGR5, EpCAM, β-catenin, and GS are strongly expressed in both ductular reactions as well as hepatocytes (magnification 200x, all sections are from the same case). Panel G shows semiquantitative scoring of LGR5+ hepatocytes versus biliary epithelial cells in A1ATD (n = 15). Scoring system is defined as negative, weak, 1+ (<10% cells), 2+ (10-50% cells), and 3+ (>50% cells).

