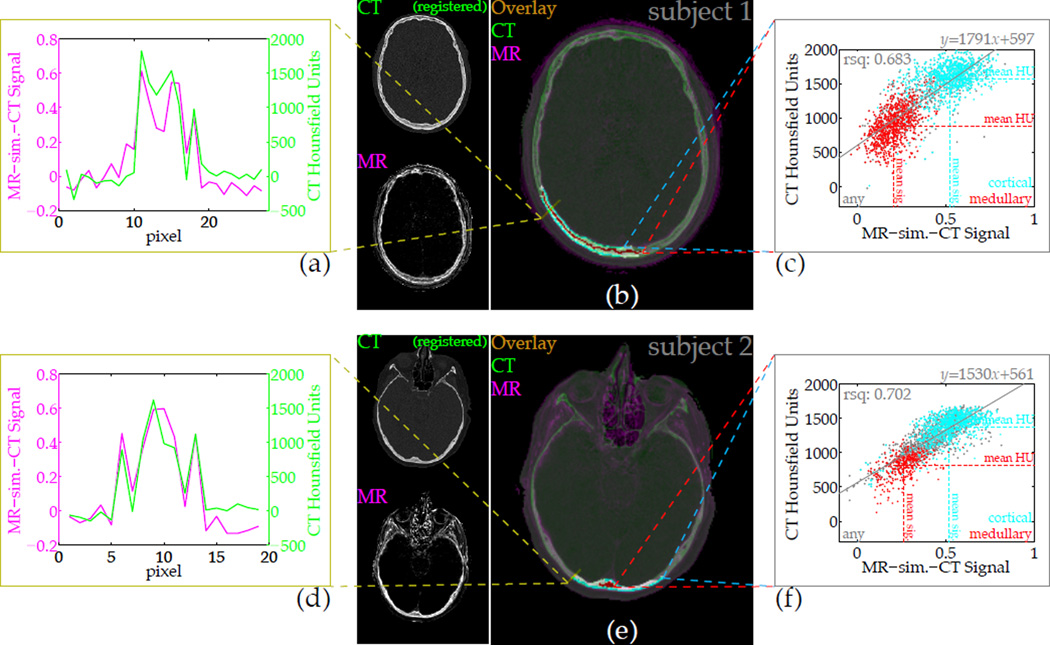
Figure 9.
The CT-likeness of contrast in the difference images can be quantified by direct comparison of intensities. After registration and resolution downsampling, a slice from the CT volume overlaid on the MR image depicts the similarity of bone contrast (b,e), and a cross-section plot of amplitudes further demonstrates the correspondence (a,d). Voxel-wise correlation of intensities depends heavily on the quality of registration, but over a large region (b,e: highlighted) selected through several slices, the normalized difference or ‘MR-sim.-CT’ signal correlates strongly with the x-ray CT Hounsfield units (c,f). Sub-classification of different bone types within the well-registered region are shown, but the signal correlation is formed over all voxels within the region.

