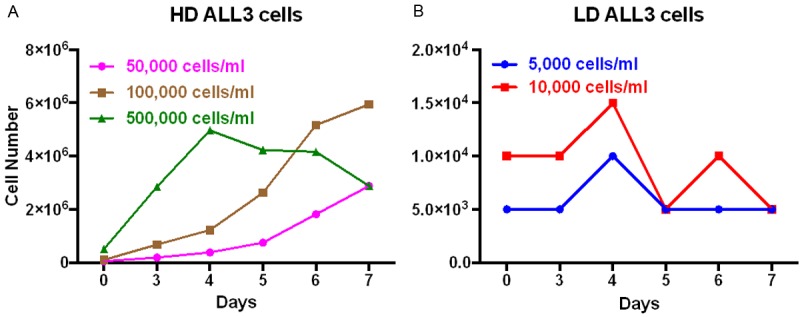
Figure 2.

Growth of the ALL3 cells at different starting cell densities. The ALL3 cells were grown in the ALL3 medium as described in ‘Methods’. Comparative growth of the ALL3 cells at starting cell density of (A) HD of 5 × 10⁴, 10 × 104 and 5 × 10⁵ cells/ml and (B) 0.5 × 10⁴ -1 × 10⁴ cells/ml. Y-axis represents total number of viable cells on different days as determined using the trypan-blue exclusion method. Note: In, (A) and (B), the Y-axis has a different scale.
