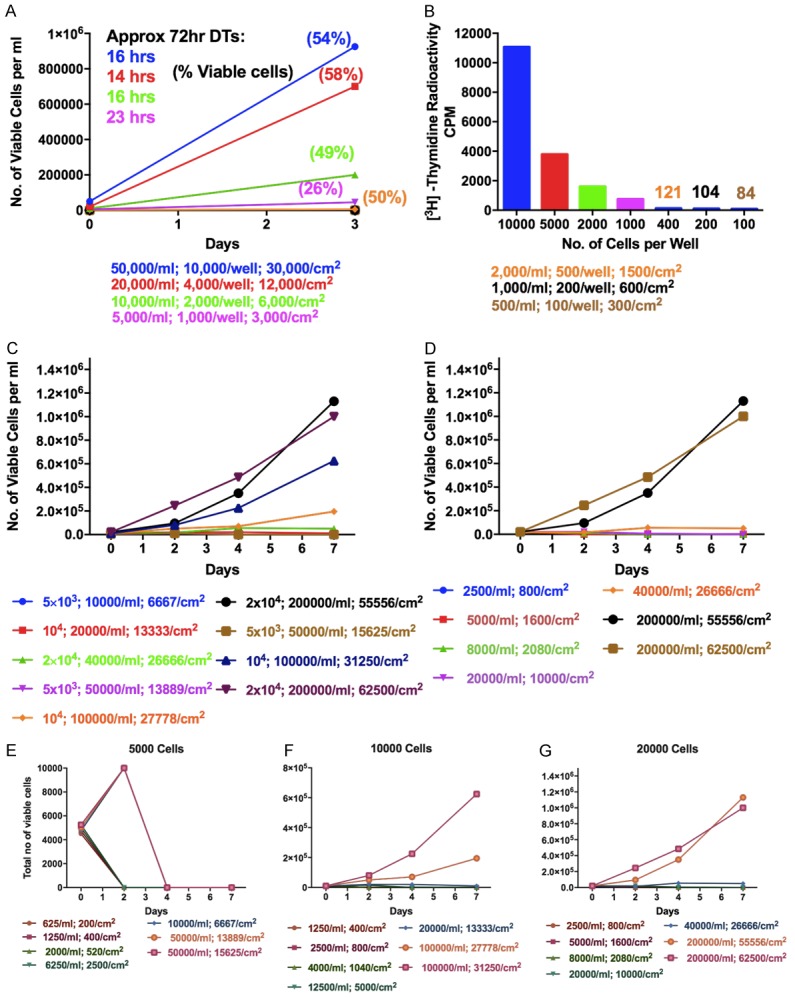
Figure 5.

Growth of the ALL3 cells at different starting cell densities per ml and per cm2 of surface area. A. Comparison of the growth of ALL3 cells at different starting densities in 96-well round bottom plates. The y-axis represents total number of viable cells per ml. Note: Because the well volume is only 0.2 ml and the bottom surface area only 0.32 cm2, the total cell numbers per well are 1/5 of those shown per ml and 3 times the latter per cm2. The doubling times shown are very rough estimates because of low cell counts. B. The [3H]-Thymidine uptake assays showing comparison of ALL3 cells kept at different starting cell densities in 96-well round bottom plates. The y-axis represents the counts per minute (CPM). C. Comparison of growth of ALL3 cells at starting cell densities of 5000, 10000, and 20000 cells per ml and per cm2 of surface area, in different size flasks, petri dishes or wells. D. Growth of ALL3 cells at different cell densities per ml and per cm2 of bottom growing area in 24 well plates. E-G. Comparison of growth of ALL3 cells at starting cell densities of 5000, 10000, and 20000 cells/ml and per cm2 of surface area in different size flasks, petri dish or wells.
