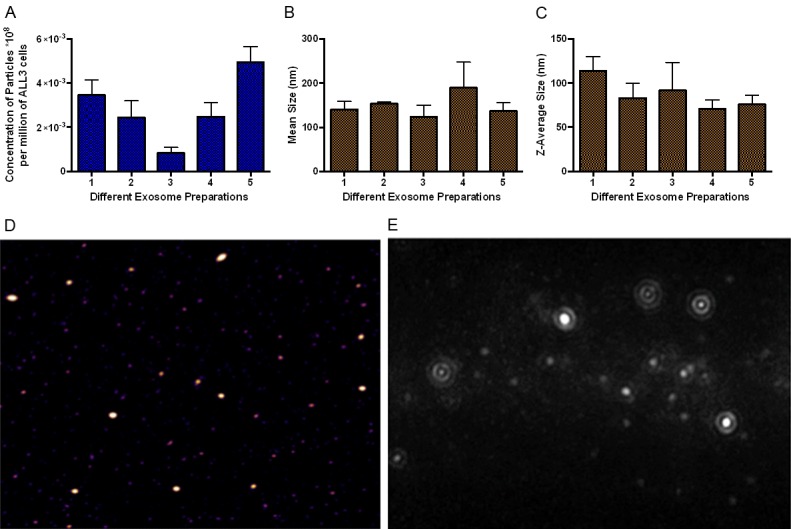
Figure 10.

Typical characteristics of exosomes. (A) Nanoparticel tracking analysis (NTA) of the HD ALL3 cells. X-axis represents concentration (number) of exosome particles secreted per million of ALL3 cells from five individual preparations. The measurements were taken in quadriplicate (B) Average size of exosomes purified from ALL3 cells using NTA from five different preparations. (C) Z-mean average size of exosomes purified from HD ALL3 cells using Zetasizer from five different preparations. (D) Atomic force microscopic image of exosomes purified from ALL3 cells. (E) Representative images of exosome particles of different sizes purified from ALL3 cells from NTA video analysis.
