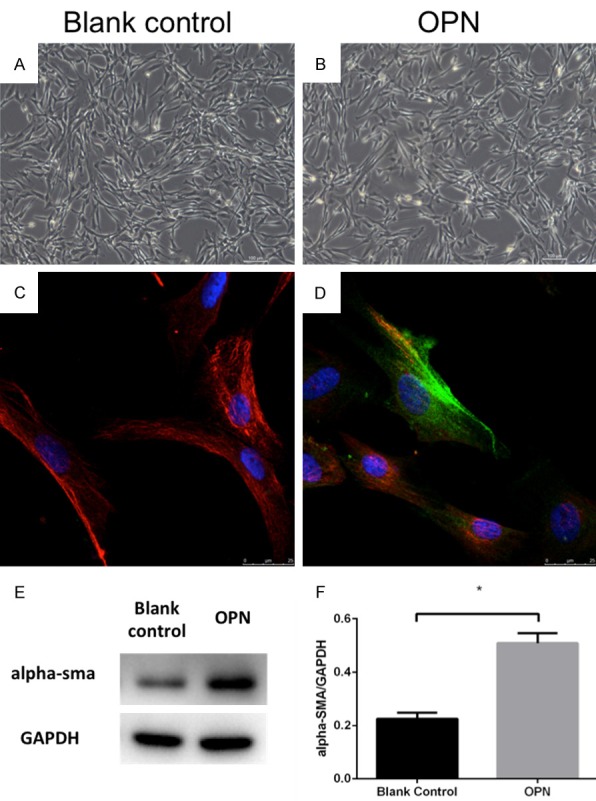
Figure 7.

Morphology of human fibroblasts: no significant difference exists between blank control group (A) and OPN (200 ng/ml) group (B) (magnification 100×, scan bar, 100 μm). Both exhibited spindle-shaped morphology. The immunofluorescent staining indicated that the α-SMA expression in fibroblasts of OPN group (D) but not in blank control group (C). Cells were stained with anti-α-SMA mAb (green), anti-vimentin mAb (red) and DAPI (blue) to stain DNA. (E, F) Western blot showed the expression of α-SMA in OPN group was significant higher than in blank control group; *P<0.05.
