
Figure 6.
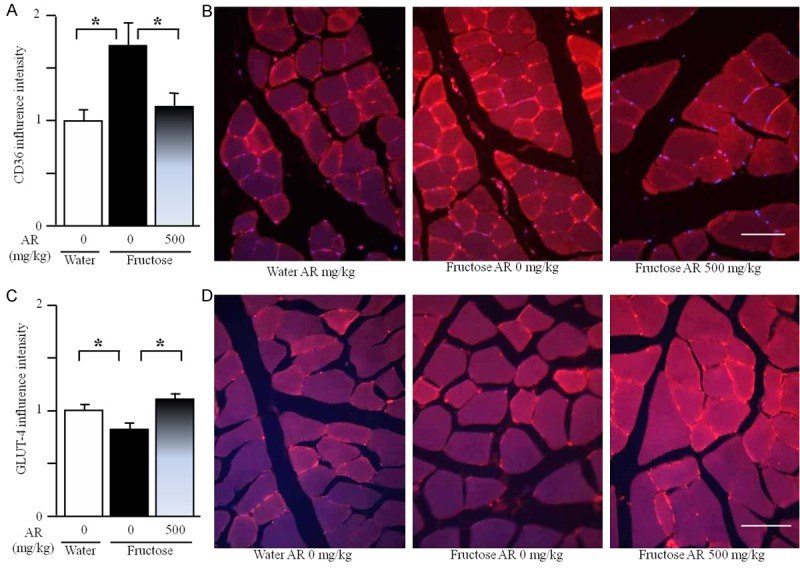
Expression of sarcolemmal CD36 (A) and GLUT-4 (C), representative images (immunofluorescence staining, B and D, scale bars: 50 μm) in the gastrocnemius of rats. The fructose controls (AR 0 mg/kg) and fructose AR (500 mg/kg) groups had free access to 10% fructose in their drinking water over 13 weeks. The water controls (AR 0 mg/kg) had free access to a tap water. AR was administered by gavage daily during the last 5 weeks. The water and fructose controls received vehicle (5% Gum Arabic) alone. After staining, the intensity of CD36 and GLUT-4 expression was determined using ImageJ 1.43. Levels in control rats were arbitrarily assigned a value of 1. Data are means ± SEM (n=6-9 each group). *P<0.05.