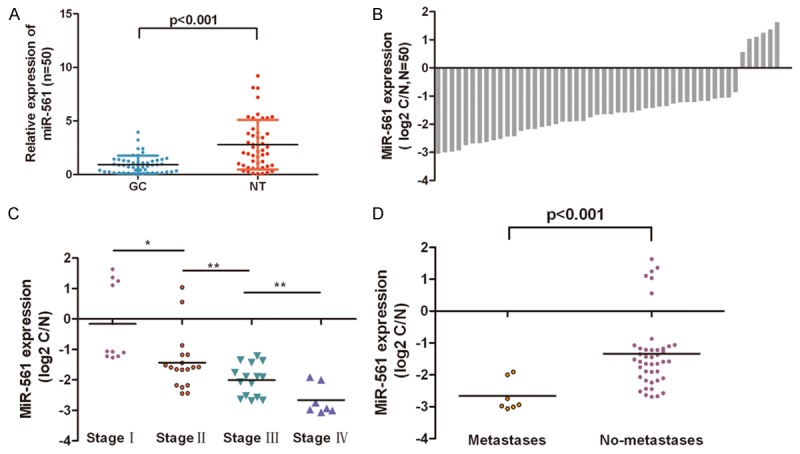
Figure 2.

miR-561 expression was down-regulated in both GC tissues. A. Relative miR-561 expression levels in GC tissues and adjacent normal tissues (NT) were determined by qRT-PCR. U6 snRNA was used as internal control. B. miR-561 was detected in 50 pairs of GC tissues and its adjacent normal controls by quantitative RT-PCR. Data are presented as log2 of fold change of GC tissues relative to adjacent normal regions; C and D. The Statistical analysis of the association between miR-561 level and pTNM stage (I, II, III and IV) and pM stage (No metastasis and Metastasis); *p<0.05, and **p<0.01, ***p<0.001.
