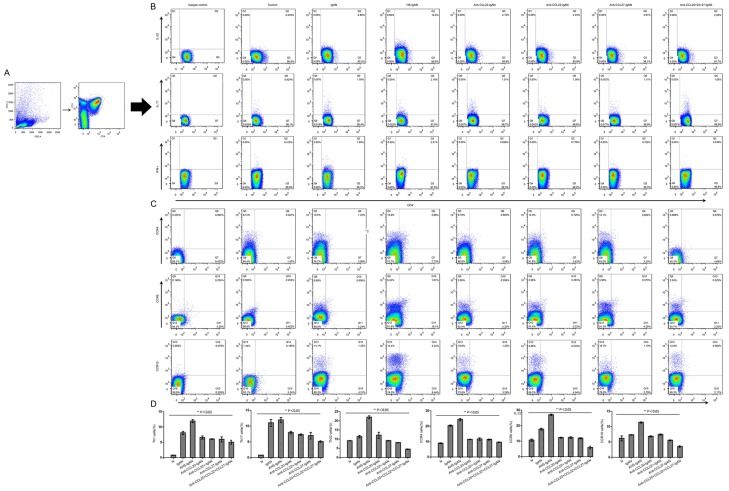
Figure 1.
Percentages of Th22, Th17, and Th1 cells and Th22 chemokine receptors expressed in both blood and kidney. A. Th22, Th17, and Th1 cells within CD4+ T cells were identified based on their expression of CD3+ and CD4+. B. Representative flow chart of Th22, Th17, and Th1 cells in the blood. C. Representative flow chart of CCR4+, CCR6+, and CCR10+ within IL-22+ T cells in the blood. D. Percentages of Th22 cells and their cell surface receptors CCR4, CCR6, and CCR10 presented increased values in IgAN mice and even higher values in HS-IgAN but were significantly downregulated in the CCL intervention group and the combination group (n=3 per group). Horizontal bars indicate the mean ± SE. The percentages of Th cells and CCRs were determined by flow cytometry, and appropriate species-matched Abs served as isotype controls.

