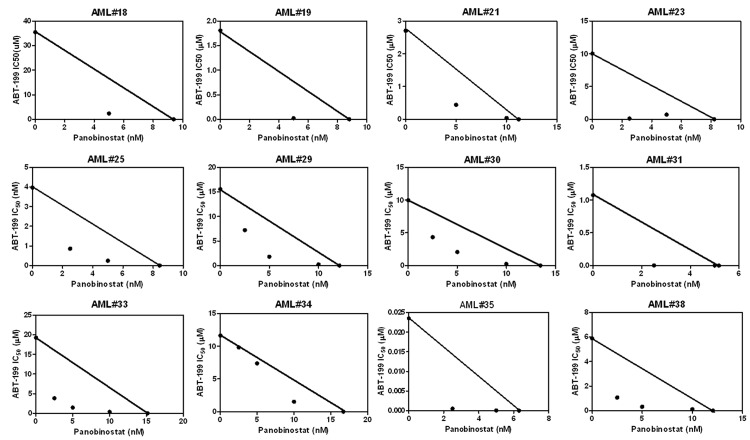
Figure 3.
Panobinostat synergizes with ABT-199 in primary patient samples determined by MTT assays and standard isobologram analyses. Primary AML patient samples were treated with ABT-199 and panobinostat, alone or in combination, for 72 h and then viable cells were determined using MTT reagent. The IC50 values are means of duplicates from one experiment due to limited sample. Standard isobologram analysis was performed to determine the extent and direction of the anti-leukemic interaction between the two agents. The IC50 values of each drug are plotted on the axes; the solid line represents the additive effect, while the points represent the concentrations of each drug resulting in 50% inhibition of proliferation. Points falling below the line indicate synergistic effect, whereas those above the line indicate antagonistic effect.

