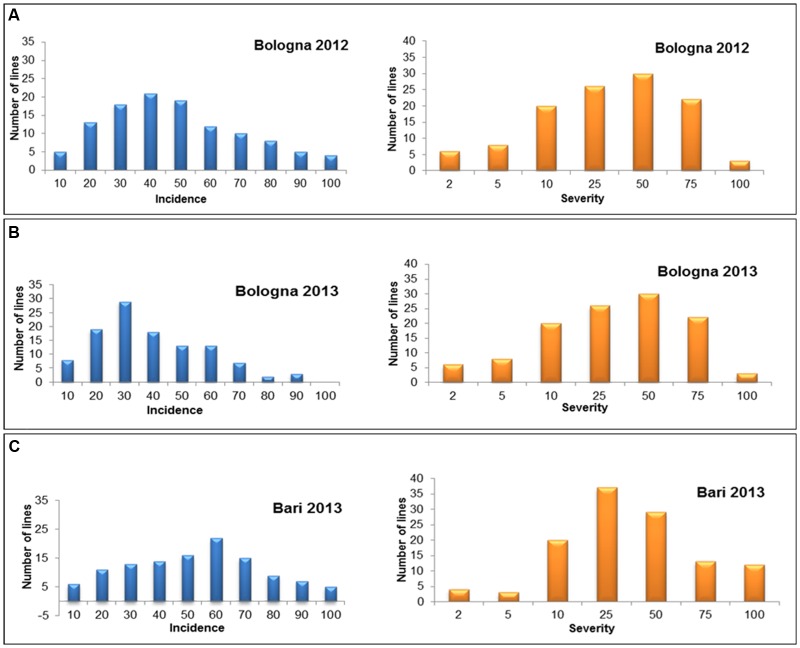
FIGURE 2.
Diagrammatic representation of frequency distribution for FHB incidence and severity in the RIL population derived from crossing the resistant 02-5B-318 line and the susceptible cv. Saragolla in the three environments of Bologna 2012 (BO12) (A), Bologna 2013 (BO13) (B), and Bari 2013 (BA13) (C).

