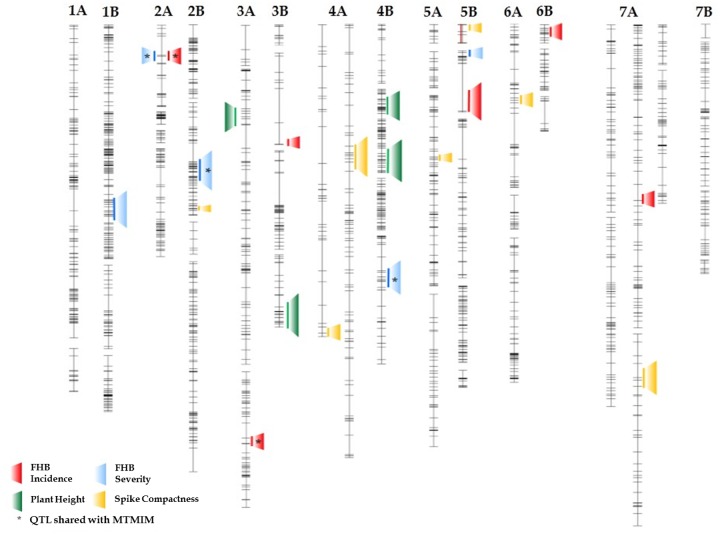
FIGURE 3.
Schematic representation of durum wheat chromosomes reporting mapped QTL (LOD ≥ 3.0) for FHB incidence (red) and severity (blue), for plant height (green) and ear compactness (yellow). The analysis was conducted with Inclusive Interval Composite Mapping (ICIM) in the 135-RIL population derived from crossing the FHB-resistant 02-5B-318 line and the susceptible cv. Saragolla.

