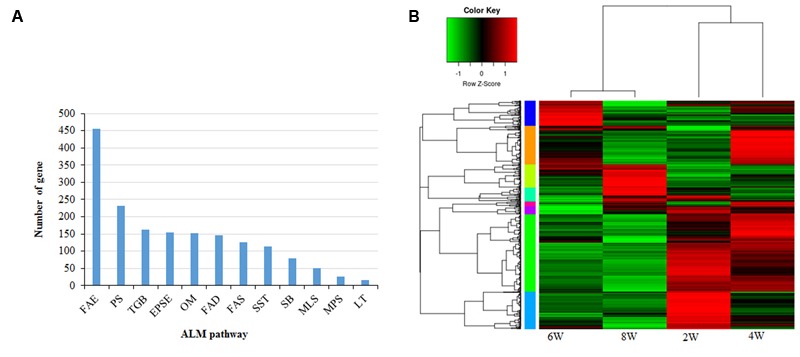
FIGURE 1.

Acyl-lipid-metabolism (ALM) genes in Brassica napus(A) Identification and distribution of ALM genes in B. napus into twelve different functional categories and number of genes in each category is shown (B) ALM genes were categorized into 8 distinct clusters based on their expression pattern. Heat map shows the relative expression of all groups. Clusters are color-coded by row sidebars: light orange (cluster 1), green–yellow (cluster 2), green (cluster 3), cyan (cluster 4), aqua (cluster 5); blue (cluster 6); purple (cluster 7) and pink (cluster 8). FAE, Fatty Acid Elongation; PS, Phospholipid Signaling, TGB, Triacylglycerol Biosynthesis; EPSE, Eukaryotic Phospholipid Synthesis and Editing; OM, Oxylipin Metabolism; FAD, Fatty Acid Degradation; FAS, Fatty Acid Synthesis; SST, Suberin Synthesis Transport; SB, Sphingolipid Biosynthesis; MLS, Mitochondrial Lipopolysaccharide Synthesis; MPS, Mitochondrial Phospholipid Synthesis; LT, Lipid Trafficking; 2W, 2 weeks; 4W, 4 weeks; 6W, 6 weeks and 8W, 8 weeks.
