FIGURE 2.

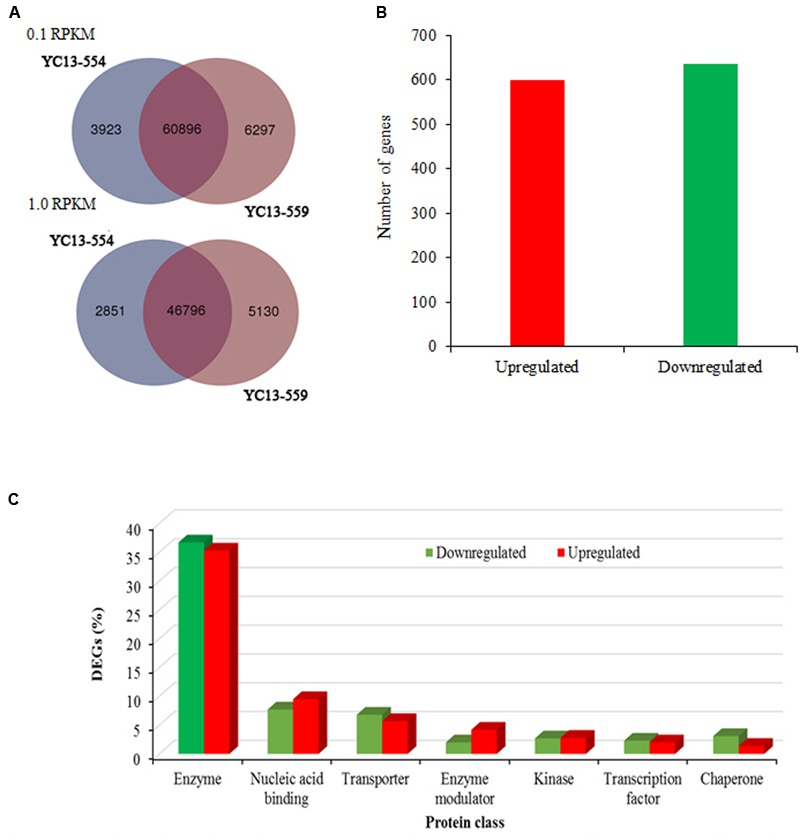
Differential expression and classification of transcripts. (A) Venn diagrams showing overlap of expressed genes having at least 0.1 reads per kilobase of transcript per million mapped reads (RPKM) and 1.0 RPKM expression value in near- isogenic lines YC13-554 and YC13-559. (B) Number of upregulated and downregulated genes. (C) Protein classification of the DEGs (n = 1234 genes; 635 upregulated and 599 downregulated) using PANTHER (Protein Analysis Through Evolutionary Relationships). Protein classes encompassing at least 2% of the upregulated or downregulated genes are shown.
