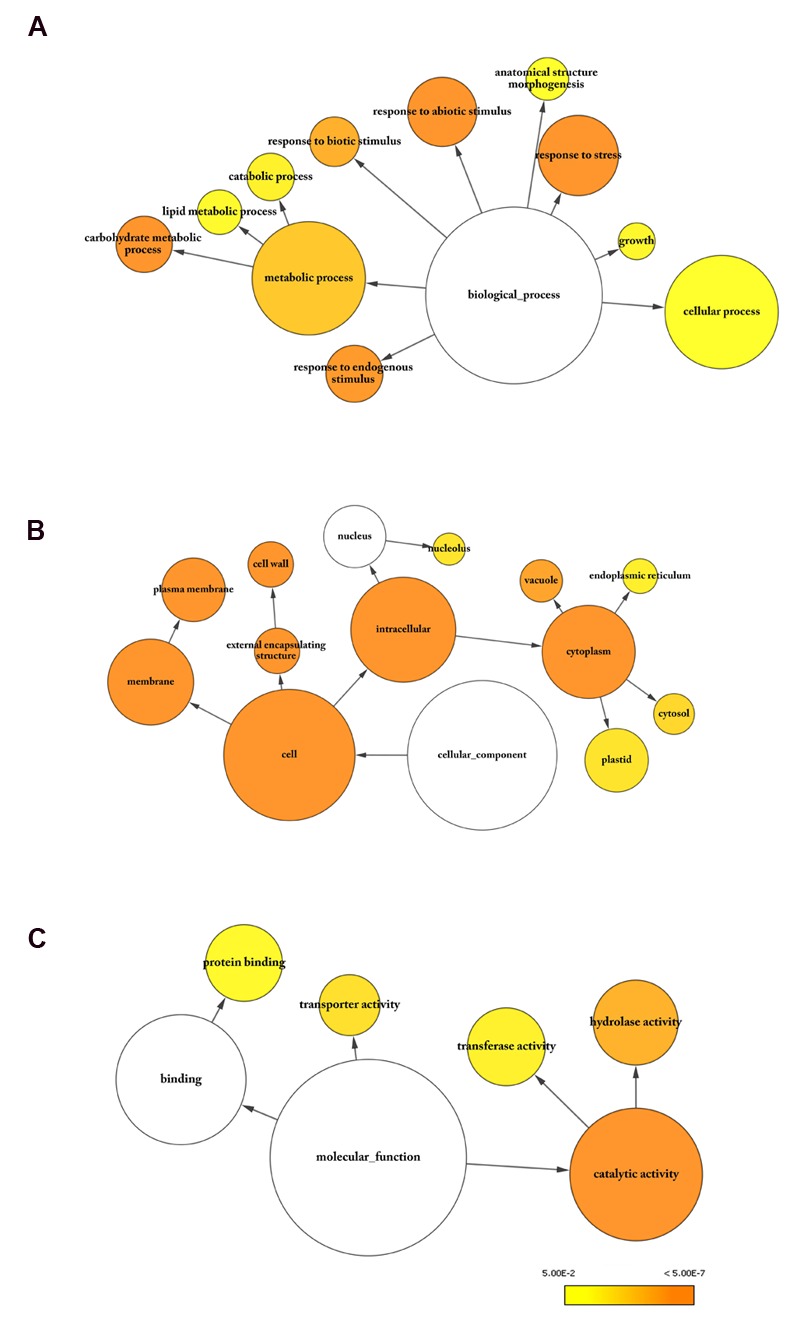
FIGURE 4.

Gene Ontology (GO) analysis of DEGs. GO analysis was carried out using BinGO (Maere et al., 2005). Enriched categories for (A) biological process, (B) cellular component, and (C) molecular function are shown. Goslim_Plants categories with significant enrichment in the dataset were highlighted in color. The size of the node is proportional to the number of molecules within the group, and the color of the node represents the significance of enrichment. Benjamini and Hochberg p-value legend is indicated below.
