
FIGURE 5.
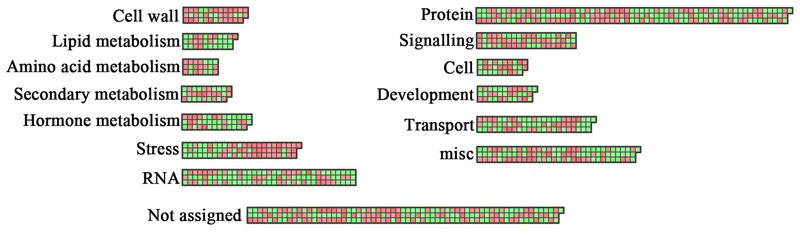
Functional analysis of DEGs using MapMan. Overview of the distribution of DEGs in different functional groups as identified by MapMan (Thimm et al., 2004) analysis. Red boxes correspond to up-regulated genes and green boxes to down-regulated genes.