
Figure 7.
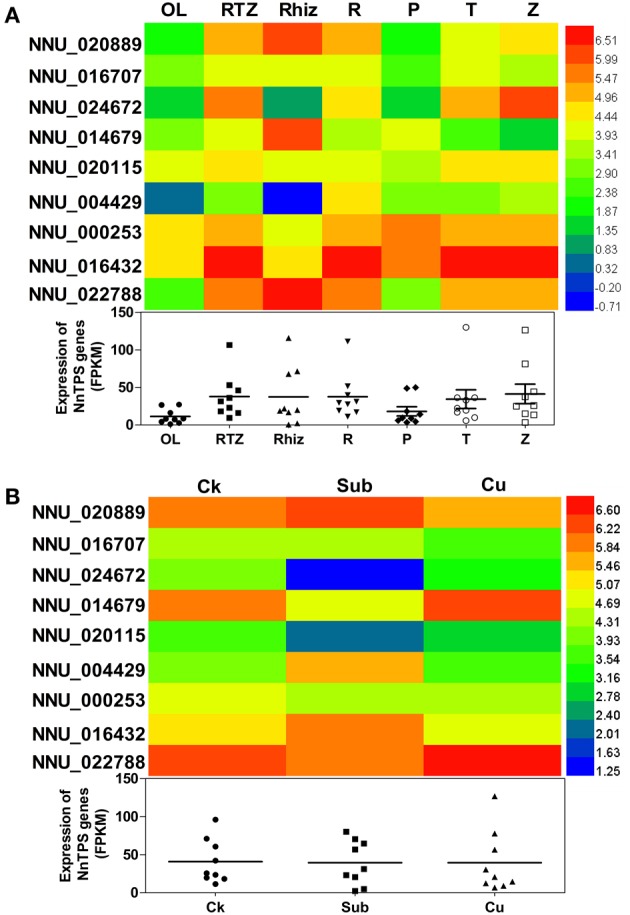
Expression profiles of the nine NnTPS genes in different tissues (A) and upon submergence and copper stresses (B). The color scale represents RPKM normalized log2 transformed data. Red indicates high expression level and blue indicate low expression level. OL, leaf; RTZ, Combined Rhiz Tip Zone; Rhiz, Rhizome internode; R, Root; P, Petiole; T, Rhizome apical tip; Z, Rhizome elongation zone.