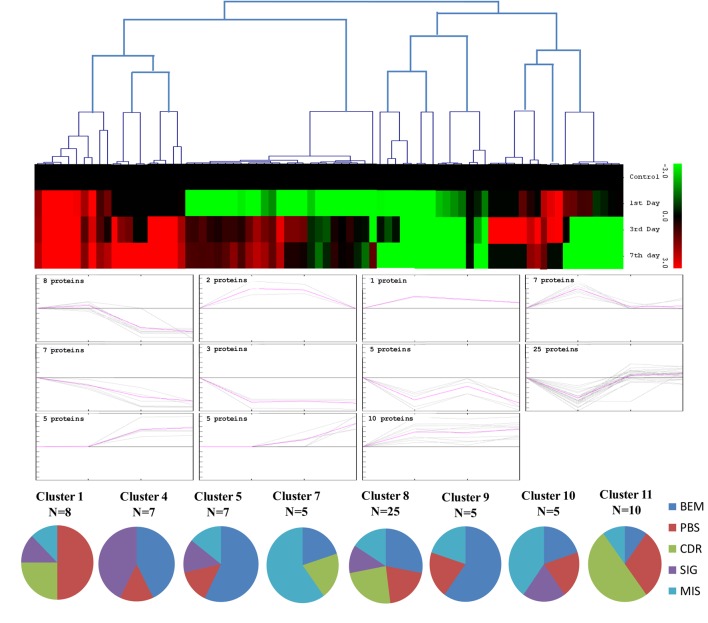
Figure 5.
Expression clustering of 78 differentially expressed proteins showing 8 clusters based on their expression profiles. The gray lines represent expression profile of protein separately and the mean expression profile is indicated by pink line. Total number of proteins with same expression profile is provided in inset within the respective cluster. Detailed information on proteins within each cluster present in Figure S1.

