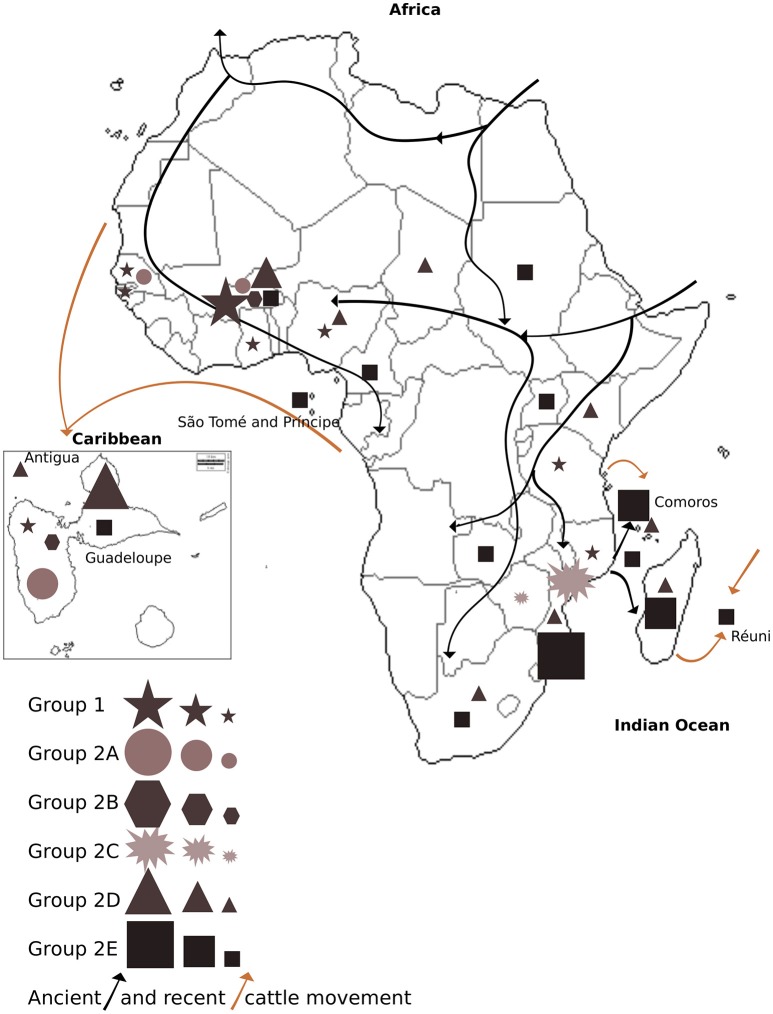
Figure 4.
Distribution of E. ruminantium genetic groups and subgroups 1, 2A, 2B, 2C, 2D, and 2E in each sampled country within Africa, Caribbean, and Indian Ocean Islands. Groups are coded by symbols according to the legend. Symbol size corresponds to sampling size defined by the following sample threshold: >15 samples (big symbol), < 15 samples (medium symbol), and < 5 samples (small symbol). Recent (< 400 years ago; brown arrows) and ancient (>400 years ago; black arrows) movement of cattle is represented in the map.

