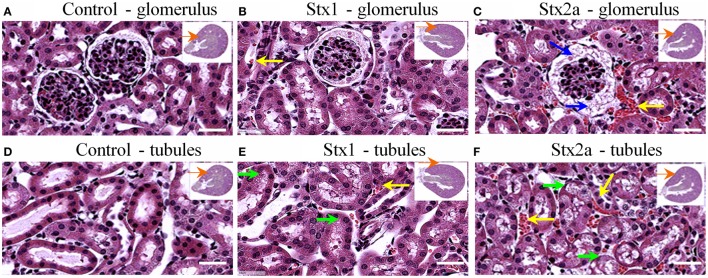
Figure 2.
H&E staining of kidney tissue at 72 h post-injection. Transverse sections of kidney tissue showing glomeruli (A–C) and tubules (D–F) of mice from Figure 1 injected with: PBS (A,D); 1500 ng Stx1 (B,E); 7 ng Stx2a (C,F). Stx2a-treated mice show increased spacing in the Bowman's capsule (C, blue arrow). Red blood cell congestion is seen in the Stx2a-treated mice (C,F, yellow arrows) and to a lesser extent in the Stx1-treated mice (B,E, yellow arrows), but not in the kidneys of control mice. Tubular necrosis was seen in animals receiving Stx1 (E, green arrows), but these lesions were much more prominent in animals receiving Stx2a (F, green arrows). Scale bar represent 50 μm. Insert, orange arrow indicates approximate position of the magnified image.

