
Figure 6.
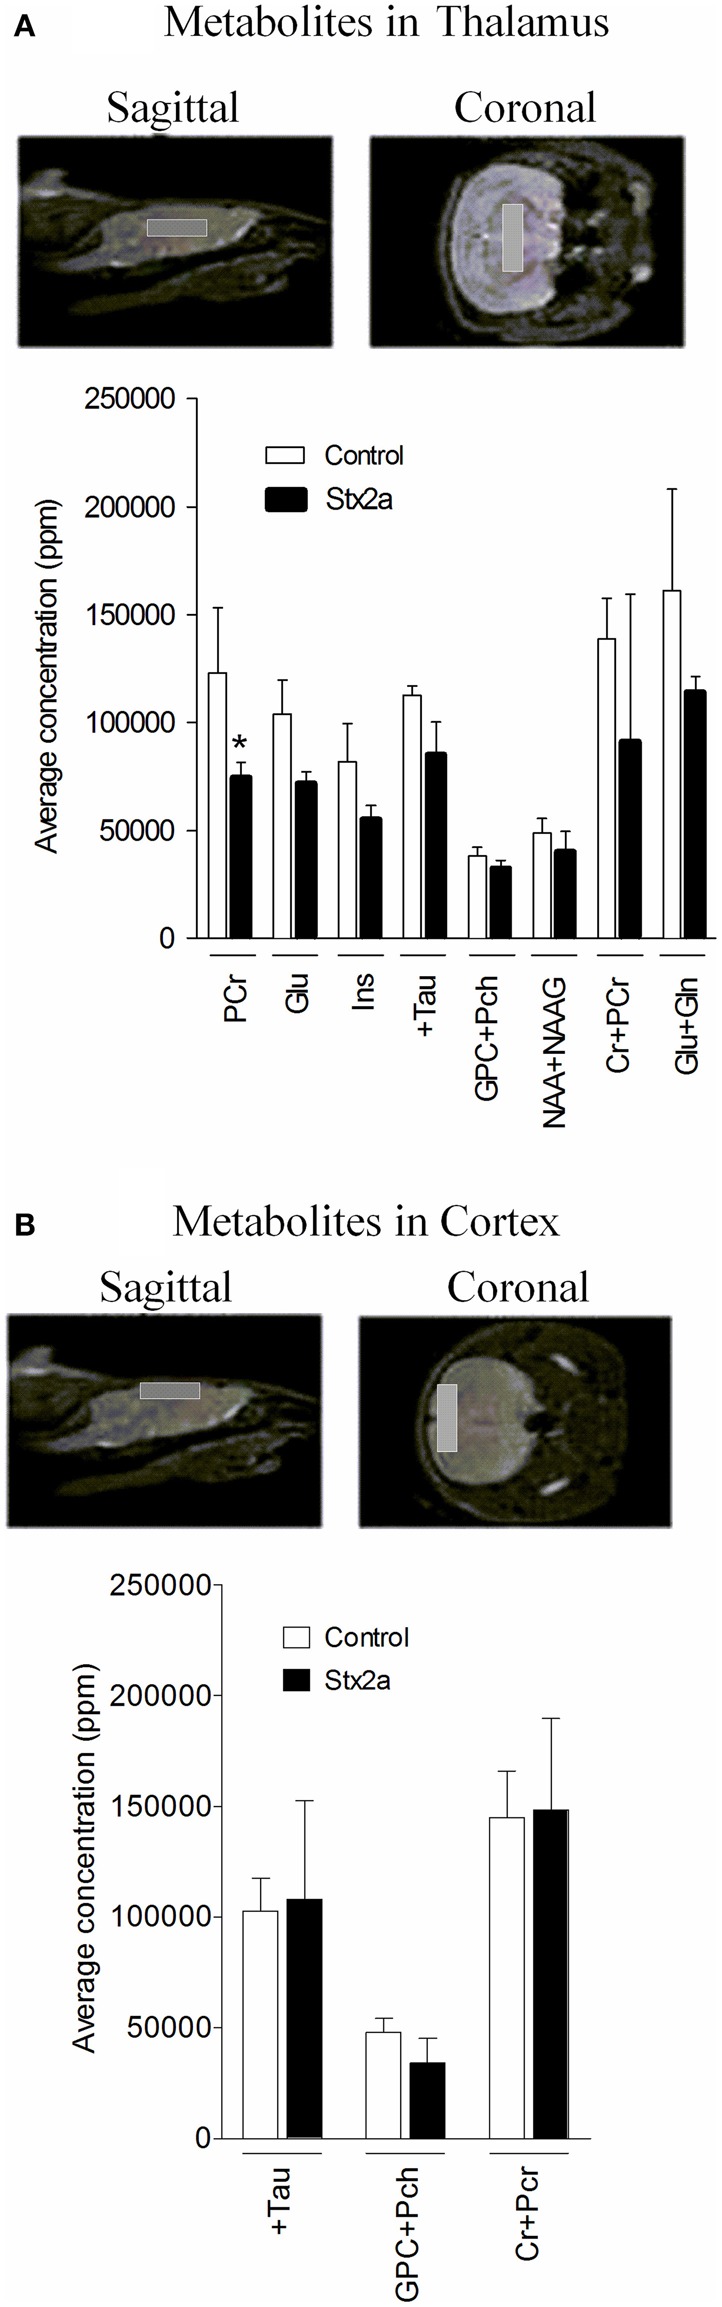
Concentrations of brain metabolites. MRI is shown indicating approximate placement of the sagittal and coronal voxel for thalamus (A) and cortex (B). Average metabolite concentrations plotted as mean ± SD for control, PBS injected (n = 3 mice) and 3 ng Stx2a-injected (n = 4 mice). Metabolites detected include: PCr, phosphocreatine; Glu, glutamic acid; Ins, myo-inositol; + Tau, taurine; GPC + Pch, choline-containing compounds; NAA + NAAG; N-acetylaspartylglutamate + N-acetylaspartate; Cr + PCr, creatine + phosphocreatine; and Glu + Gln, glutamic acid + glutamine. Two tailed Student's t-test was used to assess statistical significance (*P < 0.03).