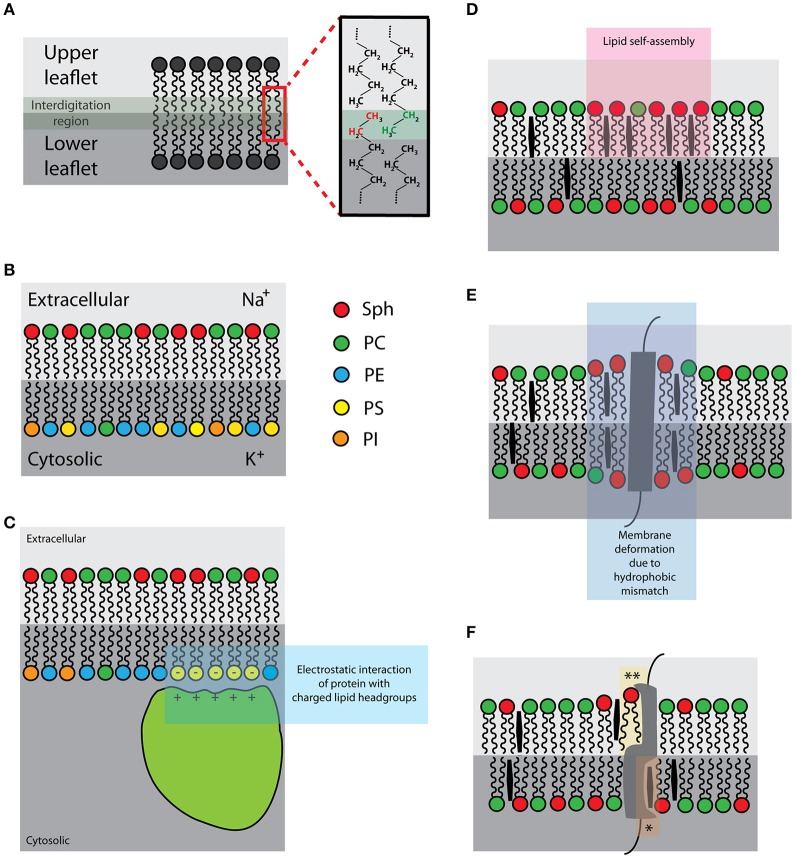
Figure 2.
Schematic illustrations of the selected intrinsic membrane properties: (A) Interleaflet coupling [interdigitating lipid acyl chains in green-gray; zoom: interdigitating ethyl groups of upper (green) and lower (red) leaflets]; (B) Asymmetric distribution of lipids and ions [right hand-side: color-coding of lipid species]; (C) Negatively charged lipids (yellow) of the plasma membrane inner leaflet [for the association of proteins with basic-rich domains (light green)]; (D) Lipid self-assemblies (pink); (E) Hydrophobic mismatch (purple); (F) Protein-lipid interactions [*sphingolipid- and **cholesterol-binding pockets].

