
Figure 4.
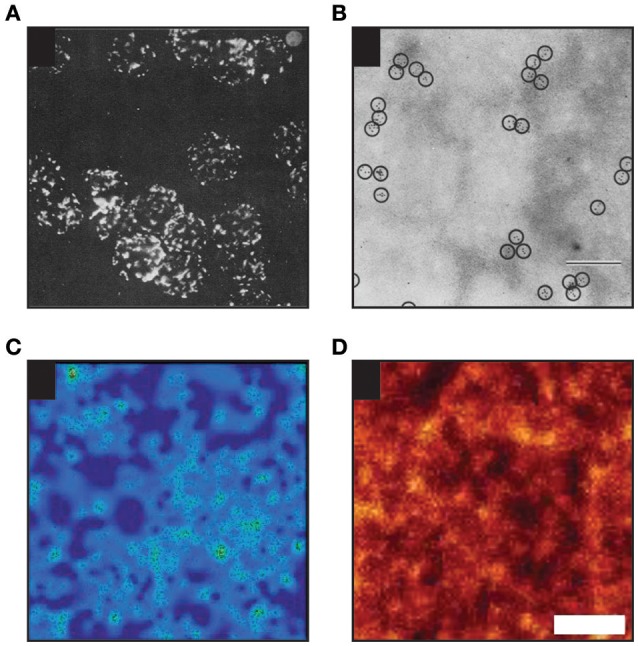
Examples of heterogenous distribution of proteins in the plasma membrane of mammalian cells. (A) Heterogenous distribution of MHC molecules as observed on murine lymphoid cells in 1967 by Cerottini and Brunner using epifluorescence microscopy (Adapted by permission from John Wiley and Sons Ltd; (Cerottini and Brunner, 1967). (B) MHC clustering on murine red blood cells as detected in 1971 by Nicolson and colleagues by electron microscopy (EM; scale bar: 200 nm; Adapted by permission from RUPress: ©1971 Nicolson et al., 1971). (C) Distribution of individual TCR molecules on activated primary human T cells analyzed by dSTORM (Adapted by permission from Macmillan Publishers Ltd: Nature Methods (Rubin-Delanchy et al., 2015), copyright 2015). Showing 3 × 3 μm area. (D) Distribution of proteins in membrane sheets derived from a neuroendocrine cell line as revealed by STED microscopy [Adapted by permission from Macmillan Publishers Ltd: Nature Communications (Saka et al., 2014), copyright 2015]. Scale bar: 500 nm.