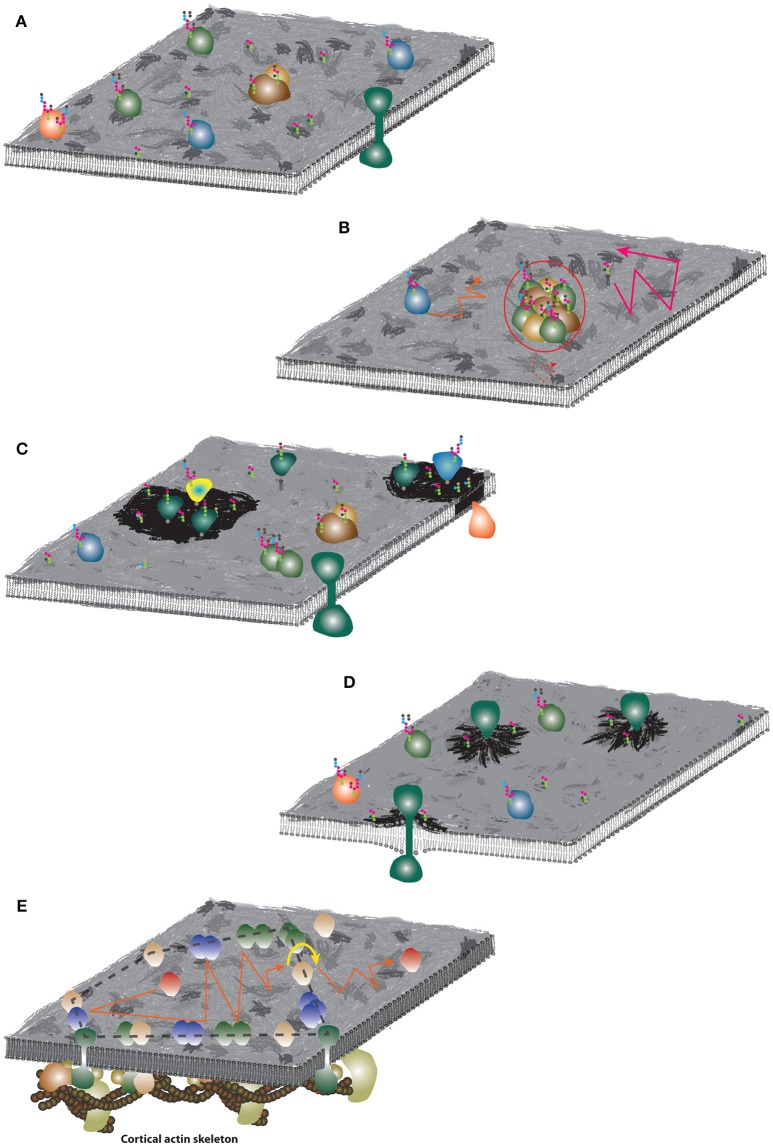
Figure 5.
Schematic illustrations of the plasma membrane organization models. (A) Fluid mosaic model. The membrane surface was artistically decorated to indicate non-homogenous distribution of molecules. Colored objects represent various species of membrane proteins, strings of colored hexagons illustrate glycosylation of proteins and lipids. (B) Hydrodynamic model. Similar mobility of lipids and proteins are indicated by orange and pink trajectories. Large assemblies (red circle) with significantly larger radius can exhibit slower diffusion (dashed red trajectory). (C) Lipid membrane domains. Dark membrane patches indicate lipid self-assemblies and different lipid (and protein) composition. (D) Mattress model. Dark membrane patches indicate accumulation of lipid species due to increased hydrophobic length of protein TMDs. (E) Picket-and-fence model. Accumulation of proteins around the underlying CA skeleton and formation of fences (dashed black line) which may restrict “free” diffusion of non-associated proteins (red) to a limited area (red trajectory). For long-distance mobility, proteins have to “hop” over the fence (yellow arrow-line) which limits their long-range diffusion coefficient.

